Test SNMP monitoring in the Agent Browser
About SNMP monitoring
When you’re setting up and configuring your SNMP monitoring, it can be useful to be able to test some of the functionality before you start applying it to your devices.
For example, you might want to confirm that the SNMP response to a specific object identifier (OID) comes in the format that you expect, or that a device can actually be connected to over UDP port 161 by your Network Node device.
To test this, you can use the Datto RMM Agent on the Network Node device to preview SNMP monitoring and connectivity.
Requirements
You should be familiar with the process of how to nominate a device as a Network Node device and how your network devices can be discovered and managed by a Network Node. For more information, refer to Network configuration and discovery.
If you are not familiar and comfortable with the concepts, terminology, and technology around SNMP, refer to SNMP background information and terminology. This document assumes you know the SNMP OIDs that you want to monitor and the thresholds (values) that you want to monitor for. You may find out more about the SNMP OIDs from the device vendor or from the device documentation.
Connecting to a network device and testing an SNMP monitor
- Log in to the Agent Browser. For more information, refer to Log in to the Agent Browser.
- Search for and connect to the device you have nominated as a Network Node. For more information, refer to Connect to a device.
NOTE The SNMP Test Tool is only available for Network Node devices. For more information, refer to Network configuration and discovery.
- Once your Network Node appears in the Connected Devices area, select it to activate the Agent Browser tools. Refer to Agent Browser tools.
- Click on the Test network devices using SNMP icon
 . This will bring up the SNMP Test Tool tab.
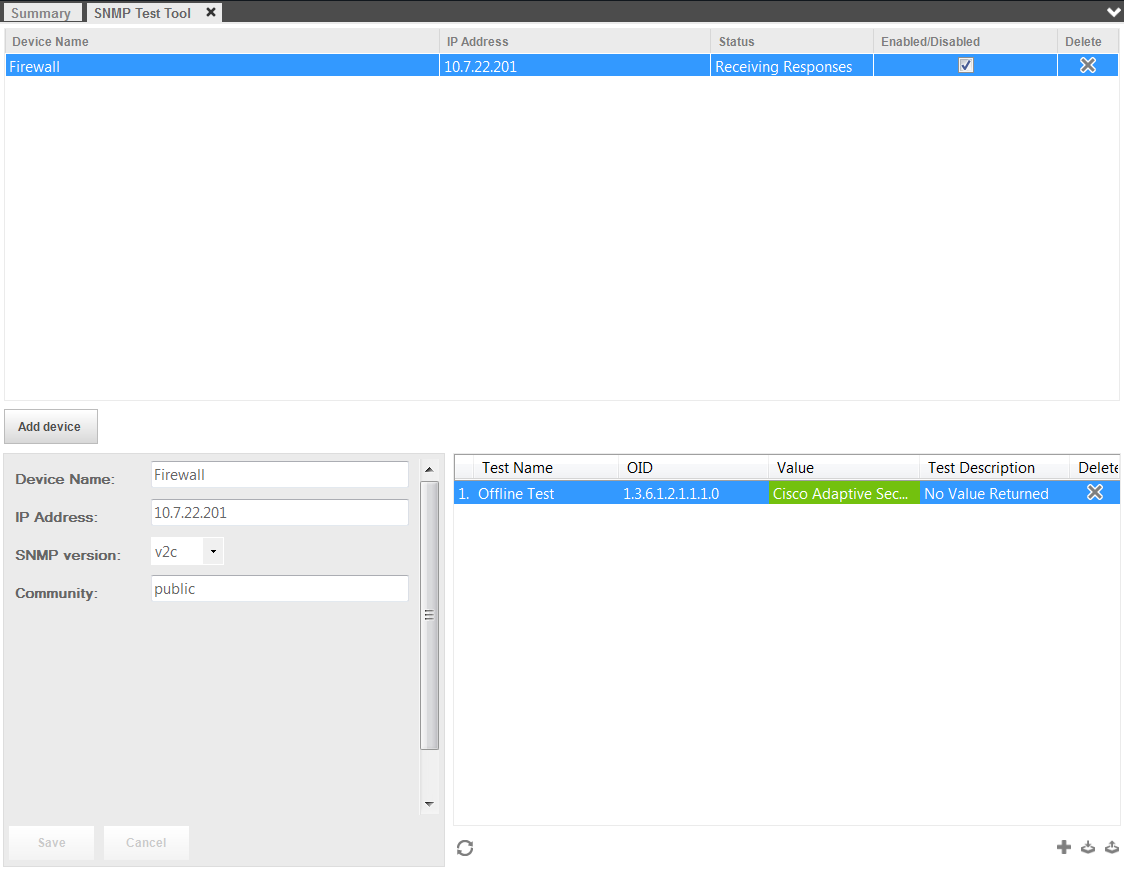
- Enter the network device details in the lower-left window.
| Field | Description |
|---|---|
| Device Name | Enter the name of the device you wish to monitor (for example, Cisco router). |
| IP Address | Enter the internal IP address of the device. |
| SNMP version | Choose SNMP version v1, v2c, or v3. If you are connecting over SNMP v3, you will also need to populate the required authentication details. For more information, refer to SNMP credentials. NOTE When you reconnect to a Network Node using SNMP v3, you will need to re-enter the credentials as they are not saved. NOTE The SHA256, SHA384, and SHA512 authentication protocols are not supported in the SNMP Test Tool. |
| Community | The community string works as a password. Enter the community string of your device. TIP The default read-only community string is "public," but your device may have a customized community string. |
- Click Save to add the device. It will now show up in the top window.
- Click the Add icon in the lower-right window to add an SNMP OID to be monitored or to test if the device is offline.
| Field | Description |
|---|---|
| Offline Test | Select this option if you want to know when the device goes offline. This will automatically fill in the following details: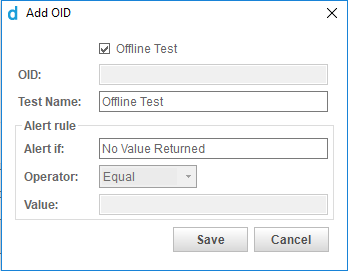 |
| OID | If you want to monitor for a setting or value, enter the OID here (for example, 1.3.6.1.4.1.6574.1.2.0). You can only enter it if the Offline Test option is not selected. |
| Test Name | Enter a name for the test (for example, Temperature). |
| Alert if | Enter the reason for the alert (for example, "System temperature is too hot"). |
| Operator | Select one of the operators from the drop-down list (Equal, Not Equal, Less, Less or Equal, Greater than, Greater or Equal, Contains, Starts with, Ends with). |
| Value | Specify the threshold for the alert.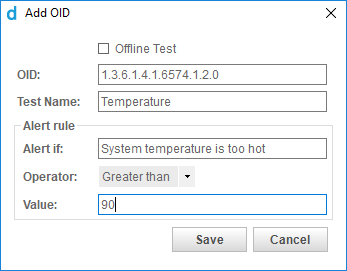 |
- Click Save.
- Repeat steps 7-8 for any additional OIDs that you want to monitor.
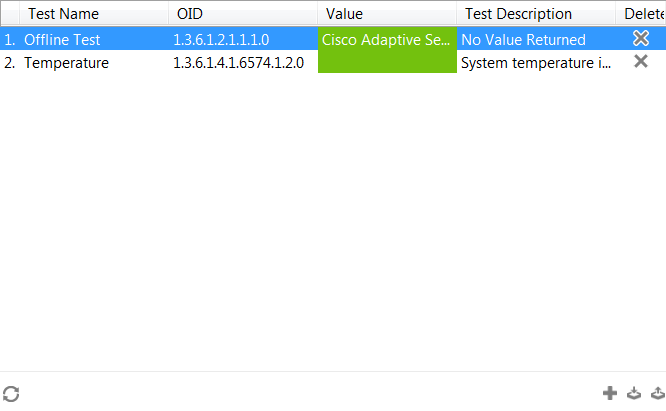
- Once the monitor has been applied to the Network Node (up to about 30 seconds), the result will be shown in the monitor in the lower-right window. Under the Value column, a green status bar will show that the current SNMP value is within your configured thresholds, while a red one will show that it is outside of an acceptable value.