Agent Health Check tool
The Datto RMM Agent Health Check tool is a PowerShell script that serves as a troubleshooting and diagnostic tool for the Datto RMM Agent.
Running the tool
IMPORTANT If the Datto RMM Support team have requested you read this document, please work from step 2 onward. Do not use the Agent Health Direct-Check component as it will not obtain log files required by the Datto RMM Support team.
- Identify which tool is most convenient for you. If your Agents are capable of running jobs, download the Agent Health Direct-Check component from the ComStore and run that. Otherwise, keep reading this topic.
- Download the Agent Health Check tool (.zip file) here.
- Extract the contents of the .zip file. It contains the Health Check tool (DattoAHC.ps1) and a PNG file explaining how to permit its execution.
- In an administrative PowerShell session, run
Set-ExecutionPolicy Unrestricted, then press Y. After running the Health Check tool you can set this back to your preferred execution level (Restricted by default). Look at the image enclosed within the Health Check tool archive for more information. - Right-click the Agent Health Check tool script (.ps1 file) and then select Run with PowerShell.
- If you are unable to resolve an issue with the tool, contact Datto RMM Support with the output file from the script. Refer to Zipping the folder and contacting Datto RMM Support.
Considerations
- This tool works for Windows-based devices and uses PowerShell versions 2.0 and above.
NOTE Windows 7 SP1 ships with PowerShell 2.0 included. Earlier operating systems will require you to install the Windows Management Framework to use PowerShell.
- You cannot run the Agent Health Check tool as a component as it requires user input. If you have set the tool to run as a component, the tool will exit gracefully.
NOTE To run a Health Check component, use the Agent Health Direct-Check component available from the ComStore.
- You must run the tool with administrative privileges for full system analysis. If you do not run the tool as an Administrator, the software will prompt the user to either run as an Administrator or continue regardless. Without administrative privileges, the tool will be unable to access some of the operational Agent data located in C:\Windows\System32.
- If the log files do not appear in the same directory as the tool, check C:\Windows\System32 as some applications may alter the path.
Checks performed by the tool
The tool divides checks into three sections.
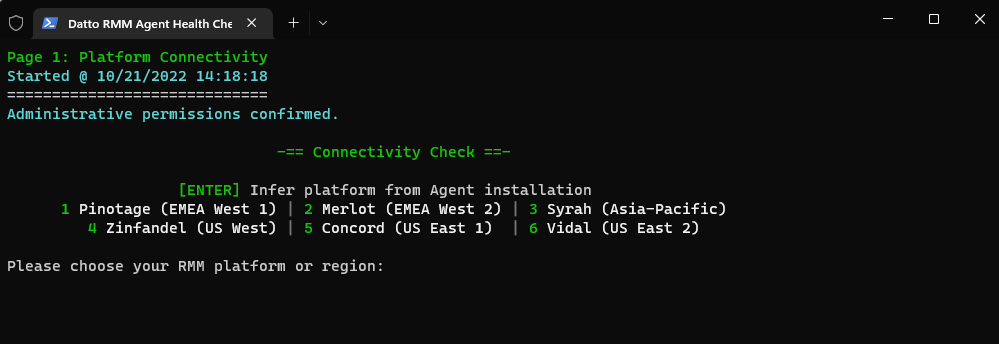
- The tool will verify that you are running the script with administrative privileges. If not, it will prompt you to relaunch as an Administrator or continue without the tool's full feature set.
- Choose your Datto RMM platform. If you have an Agent installed, the tool will detect this and offer the ability to use the platform the Agent is using (option 0). If you do not have an Agent installed, you won't see the Agent platform option.

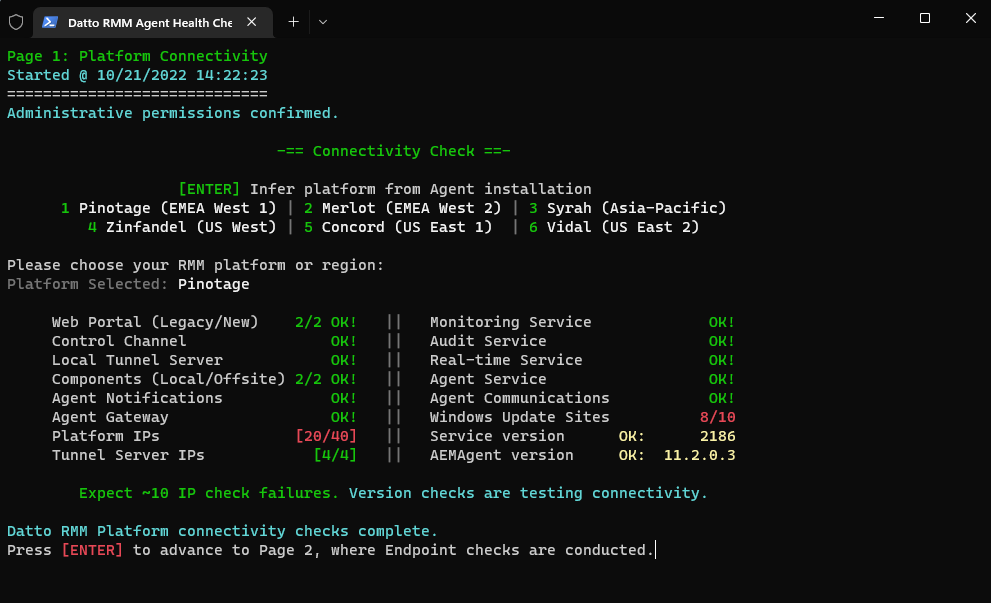
- After selecting your platform, the tool will attempt to contact the various URLs and IP addresses associated with Datto RMM. Refer to Additional IP addresses and URLs.
You'll see the results displayed on the screen. More verbose information is saved to a log file that you can export after the tool finishes the checks. - The platform check also determines what the latest version of the Agent is and displays the results. If the check finds any failures, the tool will record them in the logs at the end of the session.

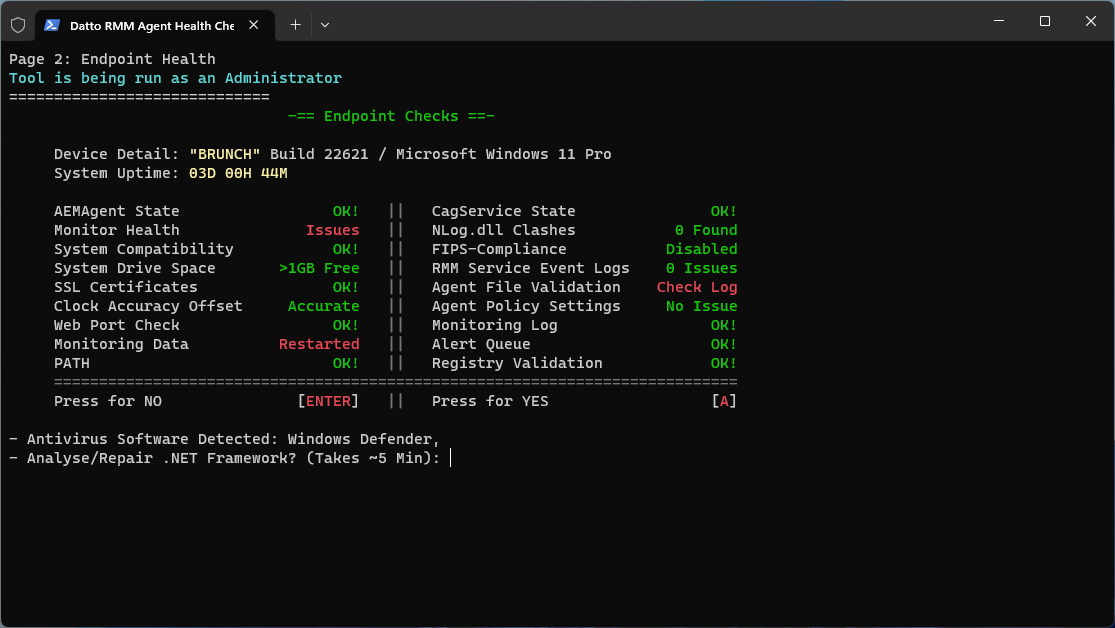
- The tool performs the following Agent and endpoint checks:
- Are the monitoring Agent and Agent services running and up to date?
- Are there any errors in the monitoring Agent log?
- Are there any other copies of NLog.dll causing clashes with our own?
- Is the operating system still being serviced by Microsoft?
- The Datto RMM Agent does not support Federal Information Processing Standards (FIPS). Does the device enforce FIPS compliance?
- Does the system drive have at least 1 GB of free space?
- Are there any recent Agent service-related errors in the Windows Event Log?
- Are the right SSL ciphers and certificates necessary for platform communication installed on the endpoint?
- Are there any values in the registry that are known to cause issues during the audit process?
- Are the record files the Agent keeps valid and verifiable?
- Is the device's local clock accurate?
NOTE Having a clock that is inaccurate by more than a few minutes can cause SSL connectivity issues.
- Does the device have an Agent policy targeted towards it that disables support or jobs?
NOTE While this is a supported configuration, it may be that such a policy was activated and then forgotten about.
- Is the device able to submit monitoring data properly?
- Is the monitoring Agent functioning correctly?
- Are the monitoring Agent's records valid and verifiable?
- Are there any failed monitoring alerts?
- What antivirus software is installed on the device?
- A list of results will be populated.
- The tool will prompt the user to run the Microsoft .NET analysis and repair utility.
NOTE The analysis may take a few minutes to perform. The tool will download the utility unless a local copy is already present on the machine.
- The tool will prompt for the user to run the Microsoft WMI analysis and repair utility (a VBS file).
NOTE The WMI analysis and repair may take more than 15 minutes to run.
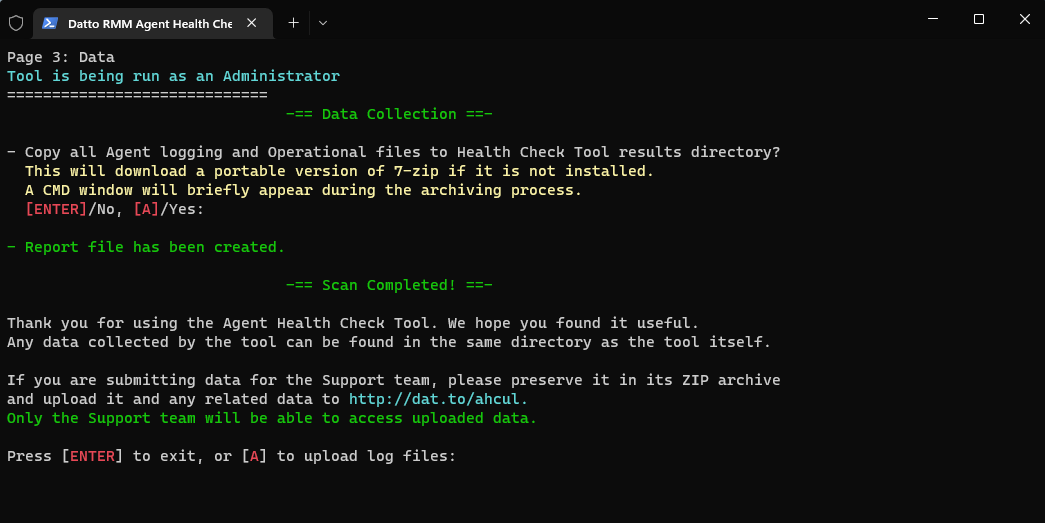
- The tool will offer to collect all Agent log files into a single folder ready for archiving.
NOTE If the tool has administrative privileges, it will also collect operational files from C:\Windows\System32, which can aid problem analysis.
Zipping the folder and contacting Datto RMM Support
The Agent Health Check tool produces a 7Zip file named after the endpoint's hostname and a string indicating the time when the tool ran.
- Upload the file to the Agent Health Check tool.
IMPORTANT Do not rename the files created by the tool.
- Make a note of the name of the file you upload so that you can provide them to your Datto RMM Support representative.
- Contact Datto RMM Support by submitting a Kaseya Helpdesk request.


