Activity Log Insights
PERMISSIONS Refer to > Activity Log Insights in Permissions.
NAVIGATION Analytics > Activity Log > Insights
About Activity Log Insights
Activity Log Insights is a Kaseya Intelligence-powered feature built into the Activity Log page that allows technicians to interact with activity data using natural language prompts. It brings together and contextualizes information from the Activity Log, such as patch management, remote control sessions, job deployments, agent updates, and UI actions taken by technicians into a single, prompt-driven interface. To learn more about how we use AI, refer to AI Capabilities in Datto RMM.
Known limitations during early access
The Activity Log Insights feature is limited to accessing the first 10,000 log records.
- Using the left navigation menu, navigate to Analytics > Activity Log.
- In the Activity Log header, to the right of the search bar, click Insights.
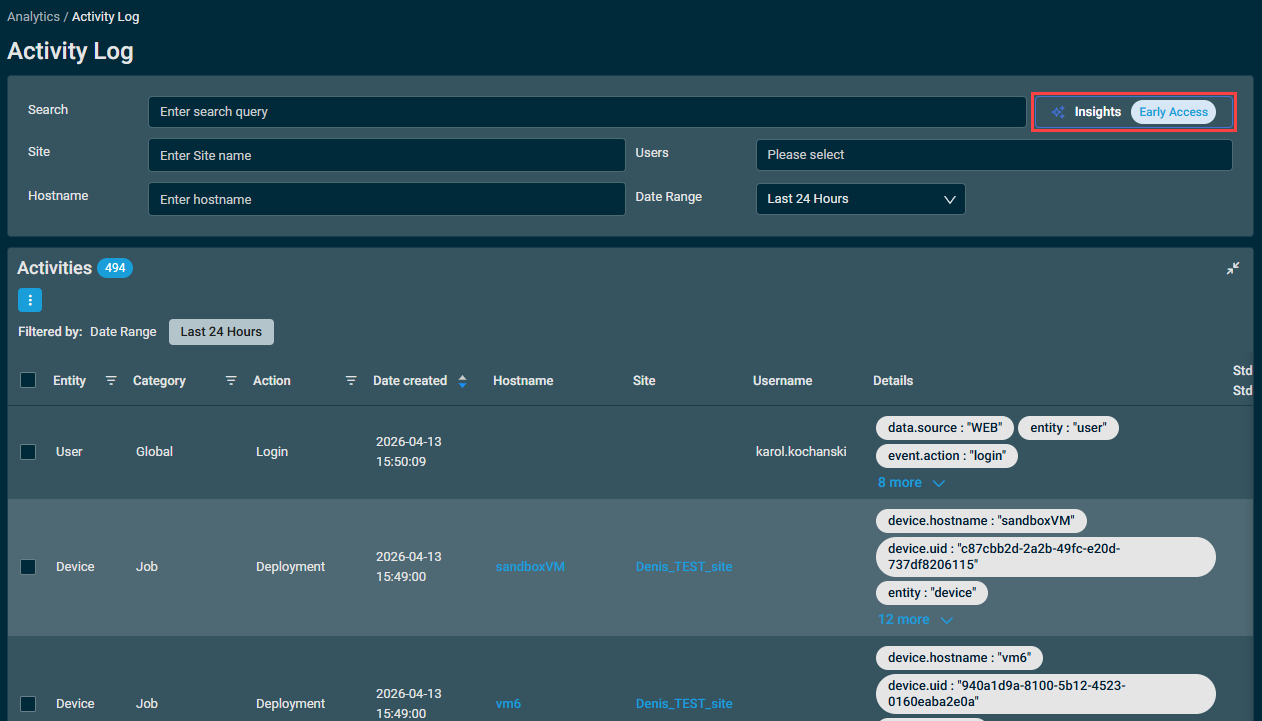
- The Insights interface loads in the main content area, presenting the prompt selection panel.
The Insights interface
The Insights interface is divided into two areas: the prompt input area at the top and the prompt selection panel below.
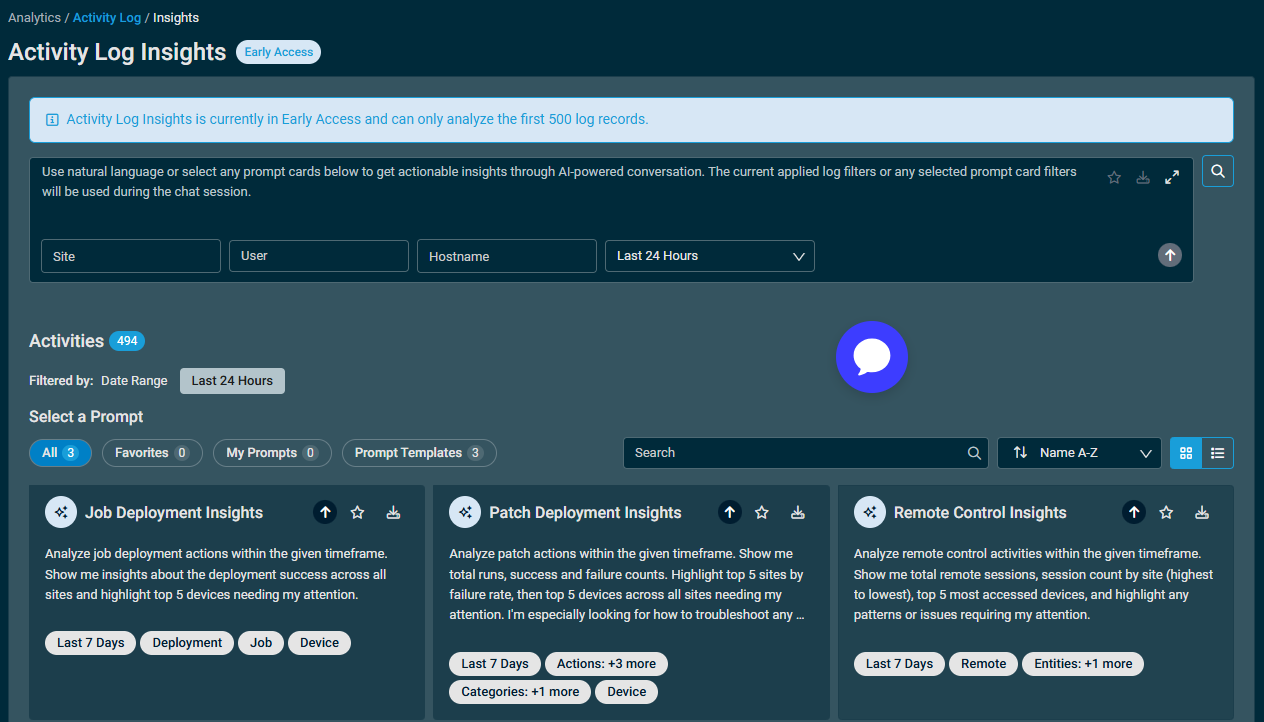
Prompt input area
In the prompt input area, type any natural-language question directly into the prompt input field. For example:
- "Show me all remote control sessions in the last 7 days, grouped by site."
- "What is my patch deployment success rate this month?"
- "Which devices have the most failed job deployments?"
In addition, you can configure the following filters using the drop-down menus at the bottom of the prompt input area:
- Site: Select the site from which to pull Activity Log data.
- User: Select the user whose Activity Log data you want to query.
- Hostname: Select the device hostname from which to pull Activity Log data.
- Time Range: Specify the time range for data collection. You can choose between Last 24 Hours and Last 7 Days.
NOTE If more than 10,000 log entries exist for the specified time range, only the first 10,000 log entries will be processed.
Prompt selection panel
Below the input area, a library of prompt cards is displayed for quick selection.
Prompts are organized into four tabs:
| Tab | Description |
|---|---|
| All | Displays all prompts contained in the other tabs. |
| Favorites | Displays all prompts you have favorited for quick access. Click the ★ (star) icon on any card to add or remove it from Favorites. |
| My Prompts | Displays all custom prompts you have created and saved. Click the ⋮ (three-dot) menu on any card to edit or delete the prompt. Click the ★ (star) icon on any card to add or remove it from Favorites. |
| Prompt Templates | Pre-built prompts provided by the platform, covering common troubleshooting scenarios. Click the ★ (star) icon to add a template to Favorites, or use the Save to My Prompts option to create an editable copy in My Prompts. |
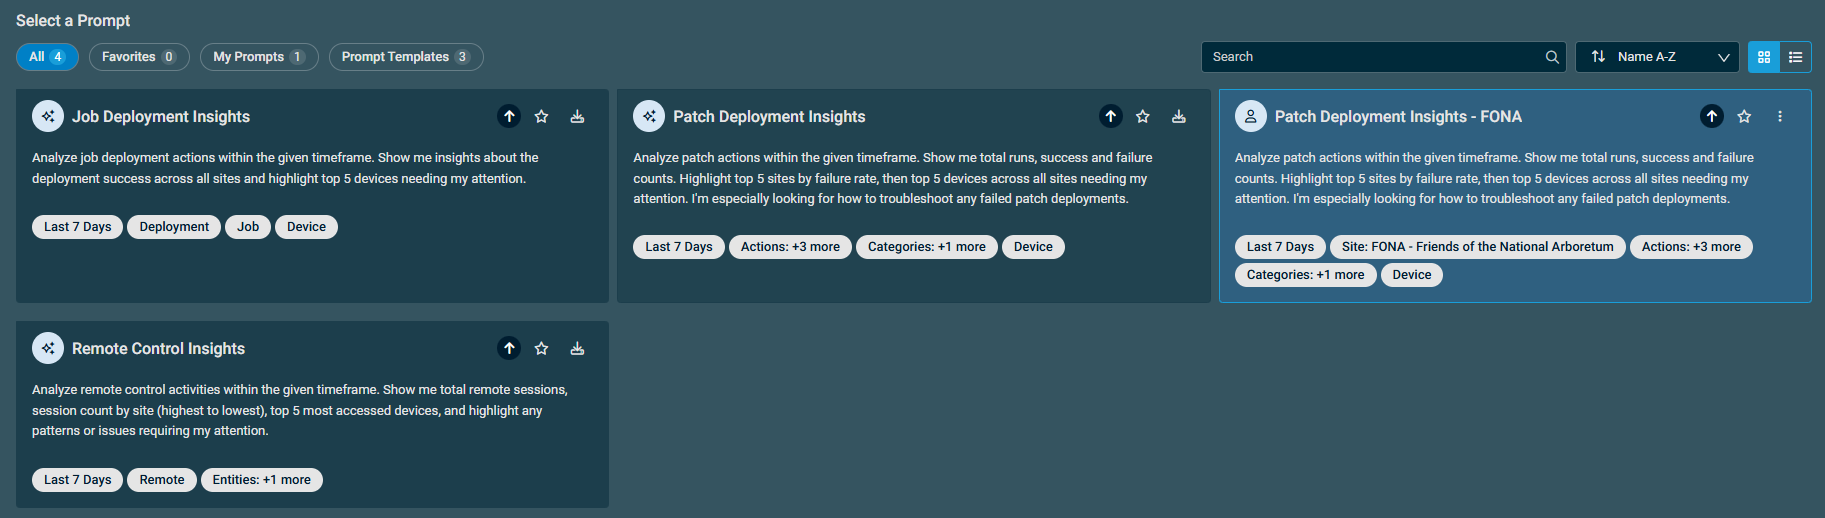
Each prompt card displays the following:
| Element | Description |
|---|---|
| Title | A short name describing the prompt's purpose. |
| Description | A brief explanation of what the prompt analyzes or generates. |
| Time Range badge | Indicates the default data window (Last 24 Hours, Last 7 Days). |
| Activity Filters badges | Shows the configured activity filters for the prompt, including actions (for example, Remote, Patch Start, Deployment) and categories (for example, Patch, Remote Control, Security). |
| Sites badge | Specific sites the prompt is scoped to, if any. |
To run a prompt to generate activity log insights, complete the following steps:
- Select a prompt card from the selection panel, or type a free-form question in the prompt input area.
- When selecting a prompt card, the prompt is loaded in the prompt input area together with associated filters. The prompt text can be edited if needed before sending it to the AI.
- Click Run Prompt.
- If using a prompt card, you can run it in its default configuration by clicking the Run Prompt quick action directly on the card.
- The interface will then transition to a split-panel view:
- Left panel (Chat): Displays the conversation thread, including your original prompt and the AI response summary. A follow-up input field at the bottom allows you to refine or drill deeper into the results.
- Right panel (Insight): Displays the generated analysis with a contextual title, structured data tables with status indicators, and recommended actions.
- Once an insight is presented, continue the conversation in the chat panel on the left side to refine, drill deeper, or ask follow-up questions.
To close out your insights session when done, you have the following options:
- Close: Close the session by clicking the X icon in the upper-right corner or Close at the bottom right. This will stop your session and return you to the prompt selection view.
- Download as PDF: Exports the current result, including charts and tables, as a document for record-keeping, internal reporting, or customer presentations.
Activity Log Insights includes pre-built prompt templates. Kaseya provides these templates ready for you to run as-is, or for use as the foundation for your own custom prompts.
NOTE While you can't directly modify a system prompt, you can select its prompt card to load the prompt input area with its configuration, and then click Save to My Prompts to make an editable copy. Refer to Managing prompt cards.
In addition to the built-in prompt cards, you can create your own cards in order to get consistent, repeatable insights. You can also edit your custom prompts and delete them as needed.
NOTE Custom prompt cards are only visible to the user who created them.
To save a custom prompt as a prompt card:
- Add your prompt text to the prompt input area.
- Click Save to My Prompts in the top right.
- Configure the Prompt Name field. The Description field will contain the configured prompt input and can also be edited at this time.
- Set the default time range using the selector in the description area (24h, 7d, 14d, or 30d). This affects time-based logs such as the Activity Log and Change Log.
- Click Save.
The prompt card will now show in the prompt selection panel with a separate icon to indicate that it is user-created.
Once a prompt has been created, you can mark it as a favorite, edit it, or delete it.
To edit a custom prompt card:
- Click the ⋮ (three-dot) menu on the custom prompt card, and select Edit.
- In the window that opens, you can edit the Prompt Name and Description fields.
- Click Save.
To delete a custom prompt card:
- Click the ⋮ (three-dot) menu on the custom prompt card, and select Delete.
- In the confirmation window, select Remove to permanently delete the prompt card.
When using Activity Log Insights, use the following best practices to help you get the most out of your results:
- Use follow-up prompts: After an initial insight is presented, ask follow-up questions to continue the conversation and drill into the specifics (for example, "Show me the patch history for the last 30 days").
- Try free-form questions: Any natural language question about the device can be entered directly in the input area.
- Filter prompts to get focused results: Configure filtering on the Activity Log page before launching Activity Log Insights to apply that filter to the prompt. The filter can be saved as part of the prompt configuration.
- Export for documentation: Use the Download as PDF option to export the output so you can attach insights to ticket summaries, documentation, or customer communications.
No, Activity Log Insights does not require you to have a specific subscription type to be eligible to use it.
Yes. When creating or editing a custom prompt, use the Sites filter to scope the analysis to one or more specific sites. Refer to the Prompt input area.
The date range determines how far back Activity Log Insights looks when retrieving activity data. Prompts support Last 3 Hours, Last 24 Hours, Last 7 Days, Last 30 Days, and Last 180 Days. The default is set per prompt and can be changed when editing a custom prompt.
Not currently. Saved prompts are private to each Datto RMM user. The ability to share prompts with team members will be added in a future release.
Yes. The prompt input area accepts any natural language question about the device. Refer to Running a prompt.


