Dashboards settings
PERMISSIONS Ensure you have at least View permission for Global > Dashboard to prevent an Access denied error message when you log in to your account. Refer to Permissions.
NAVIGATION Dashboards > click the name of a dashboard > click the Dashboards Settings icon
NAVIGATION Sites > All Sites > click the name of a site > click the name of a dashboard (left navigation menu) > click the Dashboards Settings icon
From the dashboards settings page, you can add, clone, and delete dashboards, as well as access configuration settings for your dashboards. You may also drag and drop dashboards to set their order, which is retained when dashboards are cycling. For information about adding or configuring widgets within a dashboard, refer to Widget Library. For information about how to share a dashboard, refer to Dashboard sharing.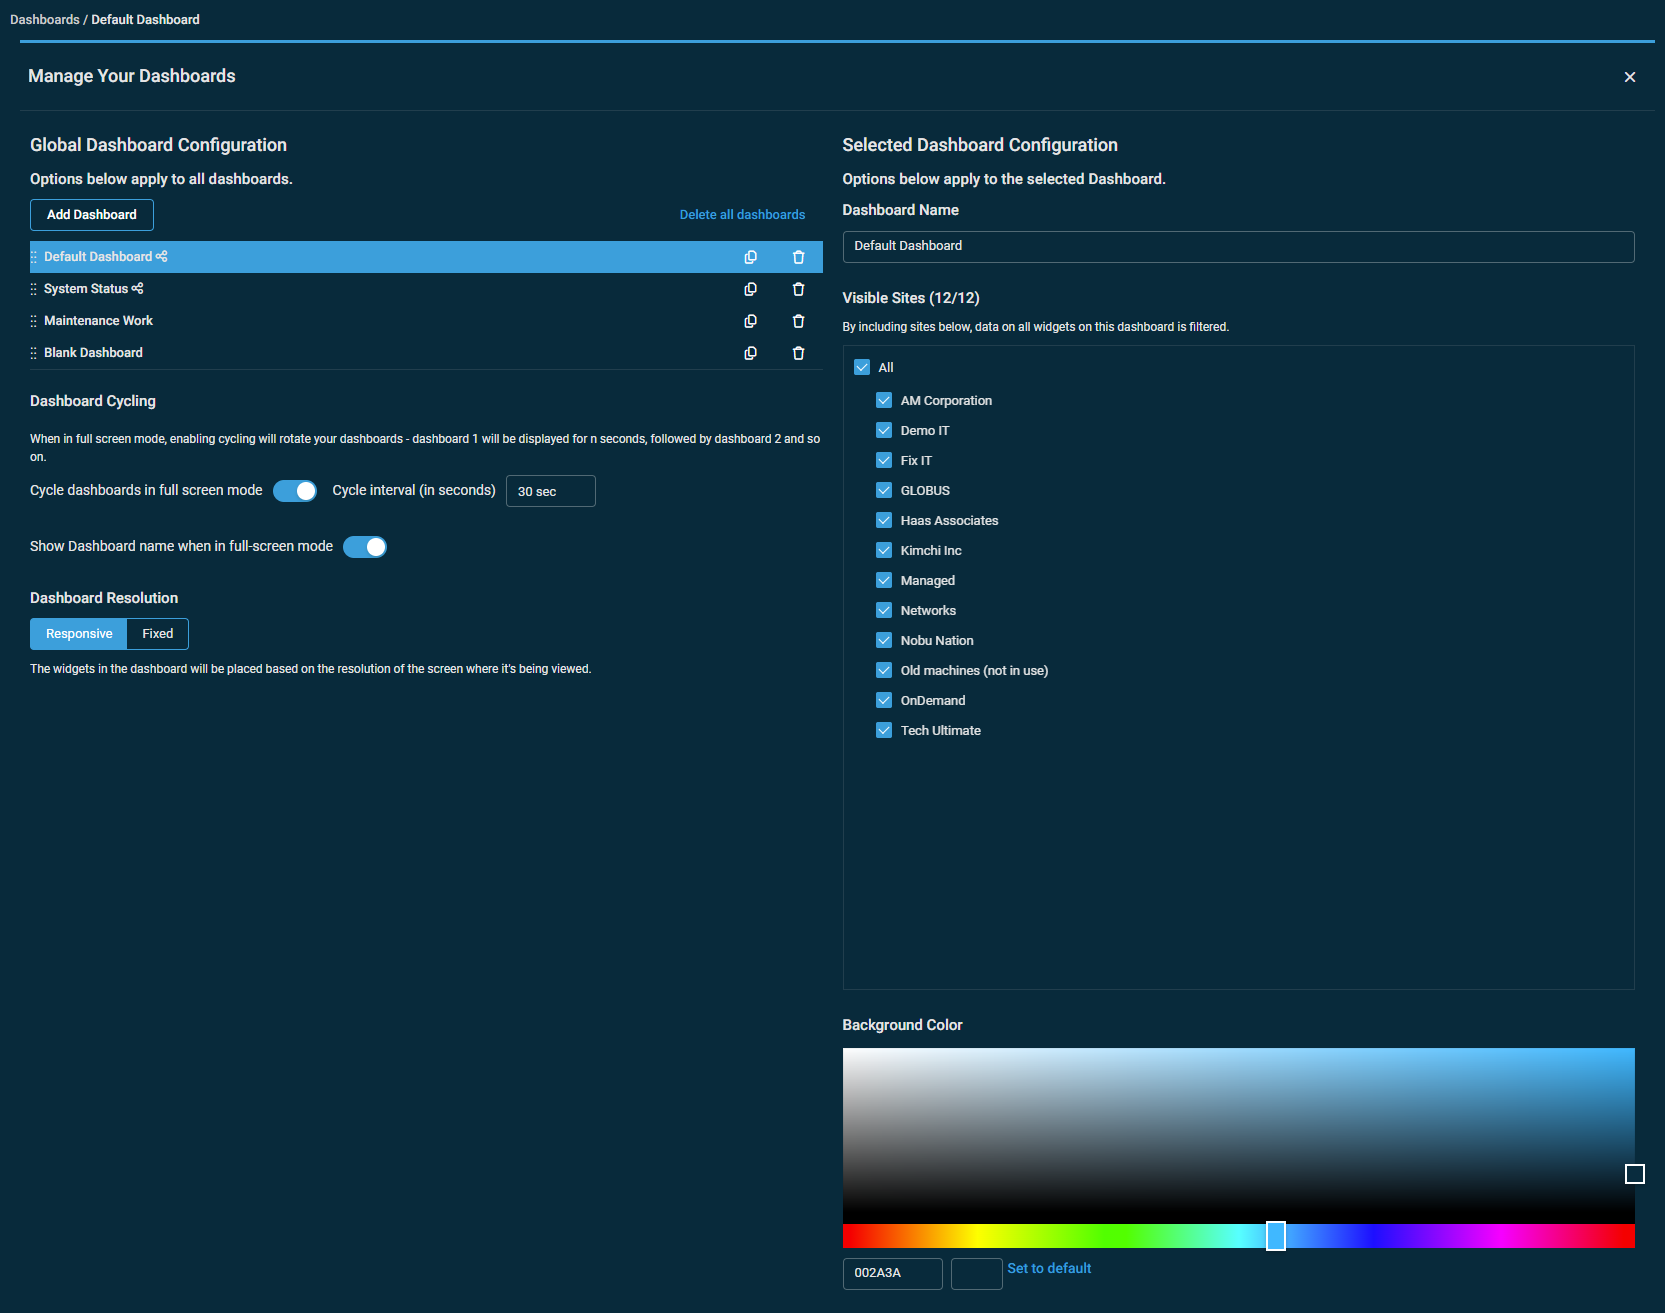
Dashboards can be added in several ways. When you access Datto RMM Dashboards for the first time, you will see the options to select a pre-made dashboard from the Dashboard Library or to create a new, custom dashboard.
You can also click the Add Dashboard button within the dashboards settings to create a new blank dashboard. The dashboard will open and be added to your dashboard list. You can switch between multiple dashboards by selecting them in this list or in the left navigation menu. You can reorder the dashboards in this list and in the left navigation menu by clicking and dragging them in this list.
You can open the Dashboard Library, which allows you to choose which type of dashboard you add, by clicking Add Dashboard in the Dashboards Toolbar. Refer to Dashboards toolbar.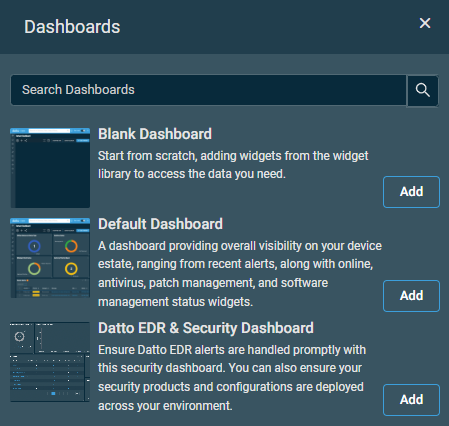
The following dashboard templates are currently available from the Dashboard Library:
| Name | Description | Availability | Default Widgets |
|---|---|---|---|
| Blank Dashboard | Start from scratch, adding widgets from the Widget Library to access the data you need. | General | None |
| Default Dashboard | A dashboard providing overall visibility on your device estate, ranging from recent alerts, along with online, antivirus, patch management, and software management status widgets. | General | |
Datto Endpoint Security Dashboard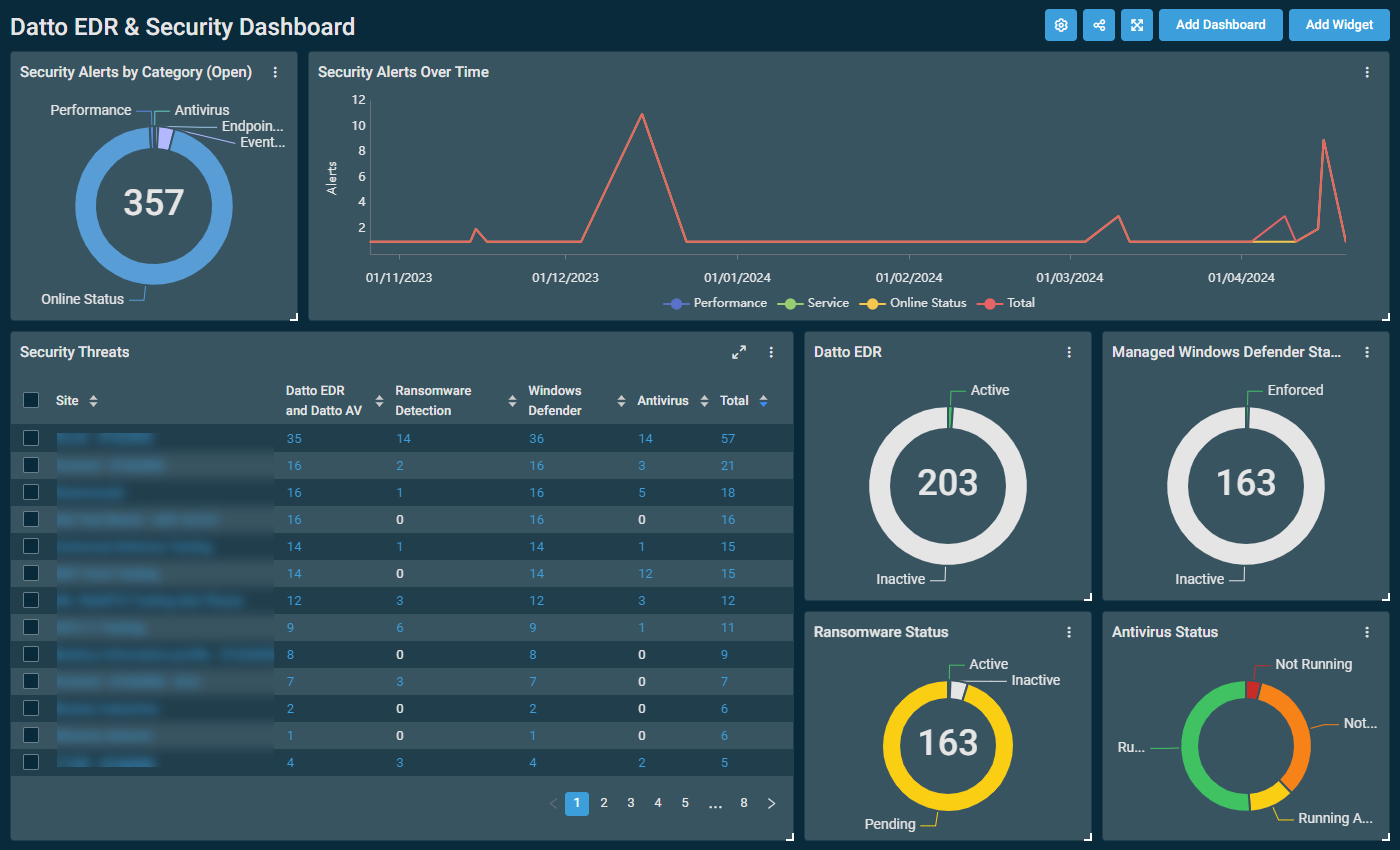 |
Ensure Endpoint Security alerts are handled promptly with this security dashboard. You can also ensure your security products and configurations are deployed across your environment. This dashboard is designed for monitors with resolutions of 1920 x 1080 pixels. However, the widgets, widget sizes, and widget organization can be customized as preferred. | Only in accounts with the Datto Endpoint Security Integration enabled. Refer to Datto Endpoint Security Integration. To learn about the Endpoint Security features in Datto RMM, refer to Endpoint Security overview. |
Select the dashboard you wish to clone, and click the Copy icon. 
A copy of the dashboard is created and named in the format "[original dashboard name] - New" (unless the dashboard is cloned from a blank dashboard, in which case it is simply called "Blank Dashboard"). The copied dashboard immediately appears in your list of dashboards within the dashboards settings as well as in the left navigation menu.
NOTE If the dashboard you clone contains a Notes widget, the widget in the cloned dashboard will link to the widget in the original dashboard. If the notes are edited in the original dashboard, the updates will appear in the cloned dashboard, and vice versa. Refer to Notes.
IMPORTANT Deleting dashboards is irreversible.
IMPORTANT Deleting a dashboard will delete all of its associated widgets and settings.
Deleting one dashboard
Select the dashboard you wish to delete and click the delete icon ![]() . You will be prompted to confirm the deletion.
. You will be prompted to confirm the deletion.
Deleting all dashboards
Click Delete all dashboards to delete all of your dashboards at once. You will be prompted to confirm the deletion.
Global dashboard settings
These options can be applied to all dashboards in your account simultaneously. They are available within the Global Dashboard Configuration section on the left side of the page.
Select the toggle button to enable or disable dashboard cycling for all of your dashboards. This will rotate your dashboards when in full-screen mode (for example, to display in full screen on a large monitor). Enter a number in seconds into the Cycle interval field to set how long each dashboard will be displayed on the screen before cycling to the next dashboard.
You have the option to configure your dashboards to conform to any screen size (responsive) or to configure your dashboards for a specific screen size (fixed).
Responsive
By default, dashboards are set to the Responsive layout. This setting causes widget placement to be based on the resolution of the screen on which a dashboard is being viewed. If the browser window is resized, the widgets will be rearranged to fit into the adjusted screen size.
Fixed
This setting causes widget placement to be fixed to a specified screen resolution (for example, you can configure the dashboard to fit on a larger screen). Upon selecting Fixed, you will be prompted to set the screen resolution dimensions (in pixels) either manually or by selecting one of the standard options from the drop-down menu.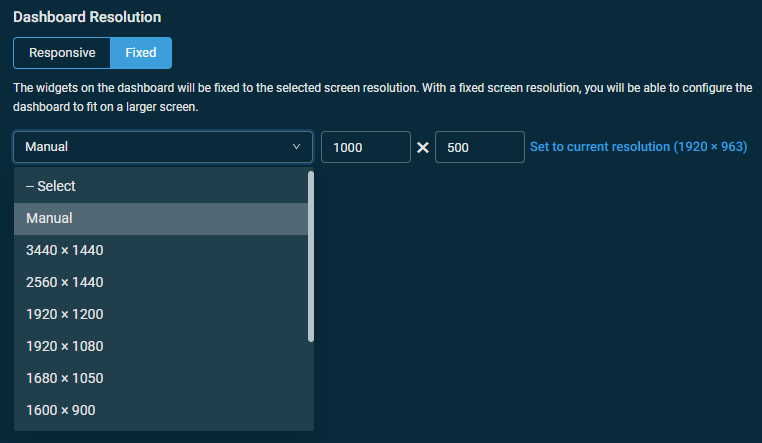
If you select Manual, enter a fixed width in the first text box and a fixed height in the second text box. Alternatively, click Set to current resolution to set the width and height to your browser's current screen resolution.
The fixed width and height you set must be between 100 and 10,000 pixels.
If you set a fixed screen resolution larger than the screen resolution on which a dashboard is being viewed, the dashboard will contain a scroll bar.
When viewing any of your dashboards, you will see a dotted-line outline that delineates the perimeter of the fixed resolution you set, which is intended to serve as a guide as you are laying out widgets. If you wish to change the fixed resolution while viewing a dashboard, click the dimensions displayed in the lower-left corner of the outline, which will open the dashboards settings page.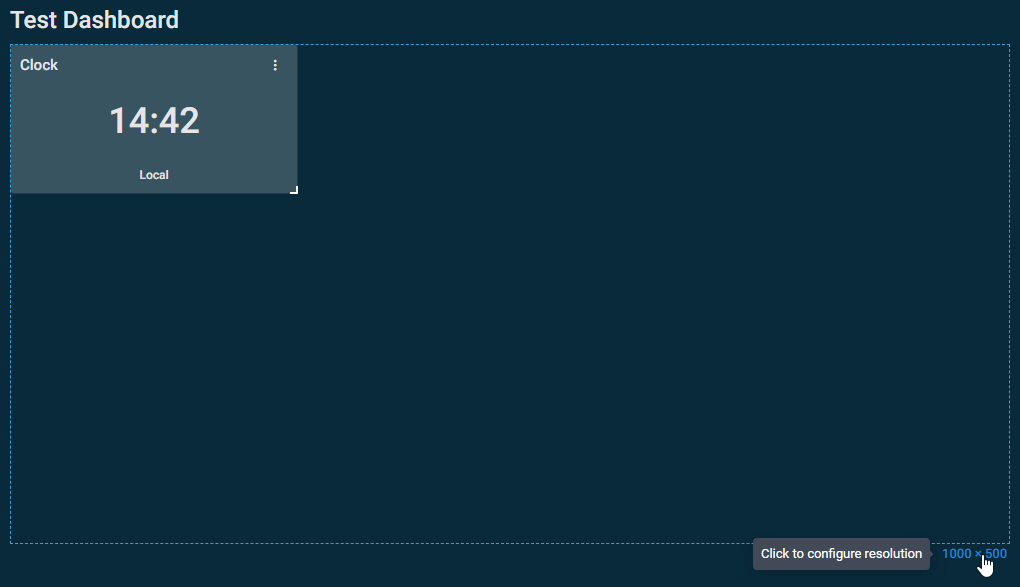
Individual dashboard settings
These options can be applied to one dashboard in your account at a time. They are available within the Selected Dashboard Configuration section on the right side of the page.
NOTE When you are configuring these settings, ensure that the applicable dashboard is selected (highlighted in blue on the left side of the page). Refer to Adding dashboards.
Within the Visible Sites section, select the sites to include in the result sets for all widgets in the current dashboard. Select All to include all sites that are in your account. 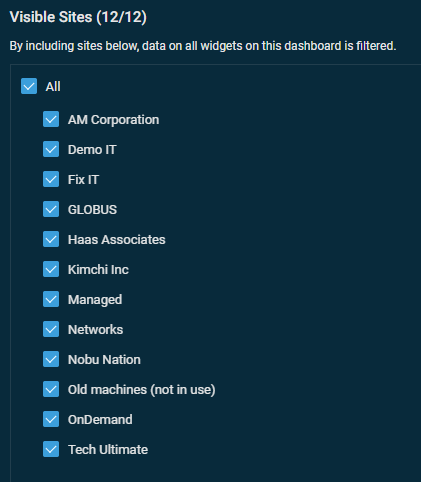
Any new sites created after All is selected will be automatically included in the list of sites as well as the result sets.
NOTE Site filtering applies only to dashboards accessed from the Dashboards menu item. Dashboards accessed from the Sites menu item will be filtered by the specific site selected rather than the sites selected in the Visible Sites list. For navigation paths, refer to Security and navigation.


