Widget Library
PERMISSIONS Ensure you have at least View permission for Global > Dashboard to prevent an Access denied error message when you log in to your account. Refer to Permissions.
NAVIGATION Dashboards > click the name of a dashboard > Add Widget
NAVIGATION Sites > All Sites > click the name of a site > click the name of a dashboard (left navigation menu) > Add Widget
Dashboards display data widgets, which are graphical interface elements that visualize and summarize information about the data in Datto RMM. In some cases, clicking on or drilling into a graphical element opens a table grid containing the underlying data. Clicking the X returns you to the main display for the widget. You can also click on an individual record to open that record.
Pre-made dashboards contain certain sets of widgets by default. To learn about pre-made dashboards and the widgets they include, refer to Dashboards toolbar.
NOTE Widgets are not clickable or editable in full-screen mode.
Widget types
NOTE Any site filters applied will constrain the result sets for the widgets. Refer to Dashboards settings.
NOTE If a widget attempts to use a device filter that has been deleted, you will be prompted to select a new device filter to use or to delete the widget.
The following widget types are currently available from the Widget Library:
| Name | Type | Description | Widget Settings |
|---|---|---|---|
Alerts Over Time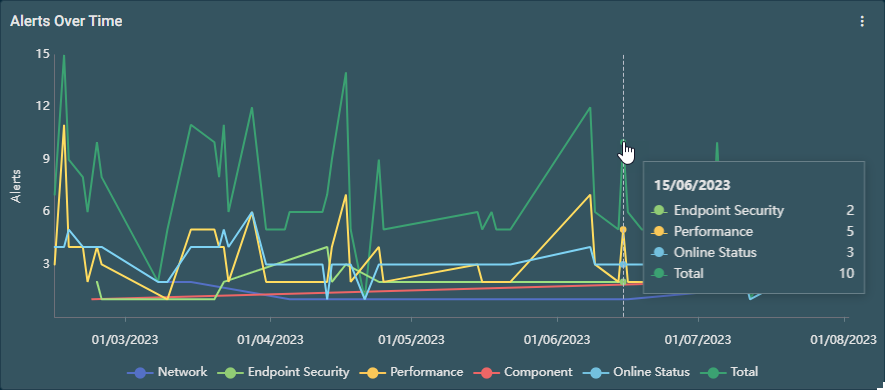 |
Line graph | Shows a line graph displaying a total count of alerts per day, sorted by alert category. Clicking on data points (for any given category or all alerts) will display a detailed alerts table. Refer to Alerts. NOTE Alerts are counted every 24 hours over night. NOTE In the Datto Endpoint Security Dashboard from the Dashboard Library, this widget is named Security Alerts Over Time. To learn how to obtain this pre-made dashboard, refer to Dashboards toolbar. |
Configure the number of days to display (minimum value: 7 days; maximum value: 180 days), the alert categories, the alert priorities, and whether to display the total number of alerts when hovering over the graph.
NOTE The Endpoint Security category is available only in the Datto Endpoint Security Dashboard. To learn how to obtain this pre-made dashboard, refer to Dashboards toolbar. |
| Ransomware Status |
Doughnut | Shows a breakdown of devices with various Ransomware Detection statuses. The color of the doughnut section provides an indication of the Ransomware Detection status for those devices. For status descriptions, refer to Ransomware Detection in Endpoint Security statuses. Clicking on a section of the doughnut allows you to drill down into a list of devices with the same Ransomware Detection status. For more information about actions you can perform on these devices, refer to Action buttons. Click Back to Dashboard to return to the dashboard. For more information about Ransomware Detection, refer to Standalone Datto RMM Ransomware Detection in this Help system and Understanding Datto EDR's ransomware detection in the Datto EDR Help system. NOTE This widget is available only if standalone Datto RMM Ransomware Detection or the Datto Endpoint Security Integration is enabled. Refer to Standalone Datto RMM Ransomware Detection and Datto Endpoint Security Integration. |
Select whether to display Active, Inactive, Pending, or All statuses and whether to show labels in the widget. |
|
|
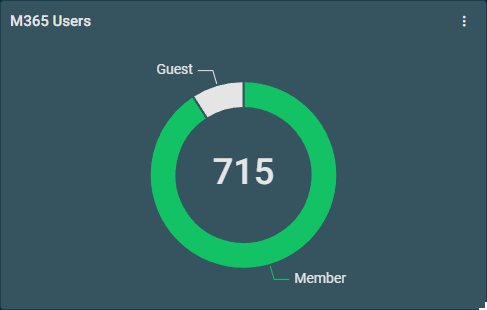
Doughnut |
Shows a breakdown of Microsoft 365 users by type. Clicking on a user type displays all users of that type for the Microsoft 365 tenant to manage those users. For information about managing Microsoft 365 users, refer to Microsoft 365 user management. NOTE This widget is available only if the Microsoft 365 Integration is enabled. Refer to Microsoft 365 Integration. |
Select which Microsoft 365 tenant to query, whether to display Member and/or Guest users, and whether to show labels in the widget. |
Datto EDR |
Doughnut | Shows a breakdown of devices with various Datto EDR statuses. The color of the doughnut section provides an indication of the Datto EDR status for those devices. For status descriptions, refer to Datto EDR in Endpoint Security statuses. Clicking on a section of the doughnut allows you to drill down into a list of devices with the same Datto EDR status. For more information about actions you can perform on these devices, refer to Action buttons. Click Back to Dashboard to return to the dashboard. For more information about Datto Endpoint Security, refer to Datto Endpoint Security in Endpoint Security policy. NOTE This widget is available only if the Datto Endpoint Security Integration is enabled. Refer to Datto Endpoint Security Integration. |
Select whether to display Active, Isolated, Needs Attention, Not Installed, No EDR Policy, or No RMM Policy statuses and whether to show labels in the widget. |
Managed Windows Defender Status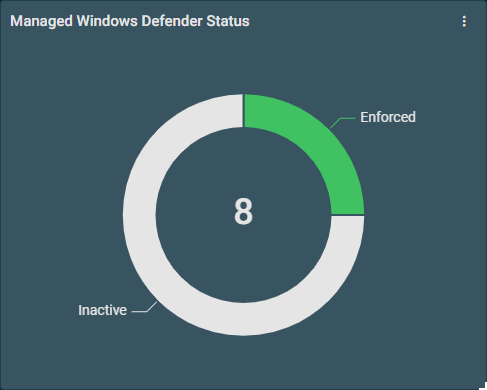 |
Doughnut | Shows a breakdown of the Managed Windows Defender statuses of your devices. The color of the doughnut section provides an indication of the statuses. Refer to Managed Windows Defender Antivirus in Endpoint Security statuses. Clicking on a section of the doughnut allows you to drill down into a list of devices with the same Managed Windows Defender status. For more information about actions you can perform on these devices, refer to Action buttons. Click Back to Dashboard to return to the dashboard. For more information about Managed Windows Defender Antivirus, refer to Managed Windows Defender Antivirus in Endpoint Security policy. |
Select whether to display Enforced, Inactive, or All statuses and whether to show labels in the widget. |
Security Threats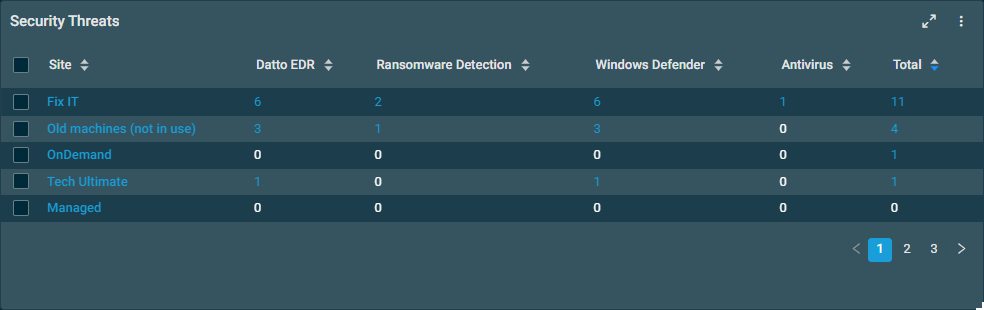 |
Table | Shows a tabular view of the number of devices in each of your sites that do not have certain security features configured. For details, refer to Security Threats table widget. Clicking on a number of devices (greater than 0) allows you to drill down into a list of the devices. For more information about actions you can perform on these devices, refer to Action buttons. Click Back to Dashboard to return to the dashboard. NOTE This widget is available only if the Datto Endpoint Security Integration is enabled. Refer to Datto Endpoint Security Integration. |
N/A |
Device Filter |
Statistics | Shows the number of devices targeted by this device filter. If the number is at least one, clicking on the number in the widget allows you to drill down into a list of targeted devices. For more information about actions you can perform on these devices, refer to Action buttons. If no results are returned within 30 seconds, the widget will display no results and an error message will show. |
A threshold can be configured above which the value will change color from blue to red. You may also change which device filter this widget displays information about by entering the name of the device filter in the text box. The search results are narrowed as you type. |
Offline Devices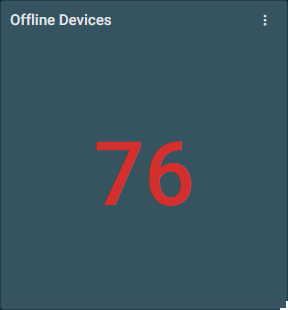 |
Statistics | Shows the number of offline devices. Clicking on the number in the widget allows you to drill down into a list of the offline devices. For more information about actions you can perform on these devices, refer to Action buttons. NOTE OnDemand devices are not included in the offline device count. |
A threshold can be configured above which the value will change color from blue to red. You may also select the device types to display. |
Offline Devices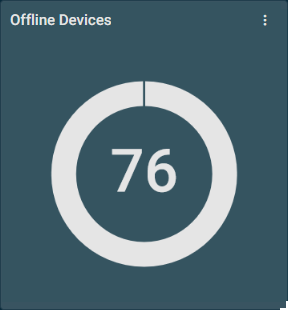 |
Doughnut | Shows the number of online and offline ESXi hosts, servers, and network devices. Clicking on a section of the doughnut allows you to drill down into a list of those devices. For more information about actions you can perform on these devices, refer to Action buttons. NOTE OnDemand devices are not included in the offline device count. |
N/A |
Offline Devices by Device Type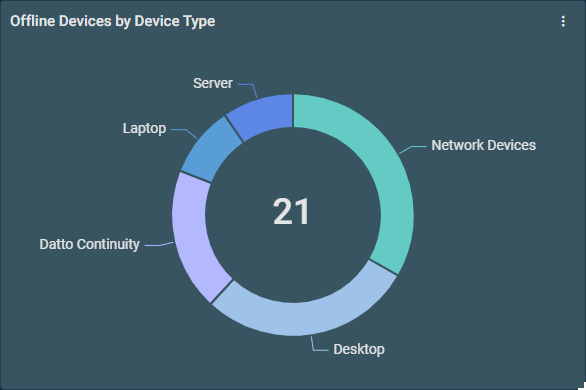 |
Doughnut | Shows the number of offline devices by Device Type. Clicking on a section of the doughnut allows you to drill down into a list of offline devices of the same device type. For more information about actions you can perform on these devices, refer to Action buttons. NOTE OnDemand devices are not included in the offline device count. |
Select the recency of offline devices to display, the device types and whether or not to display device type labels. |
Offline Devices |
Tree map | Shows a tree map of offline ESXi hosts, servers, and network devices. Each rectangle represents a site's offline devices. The size of the rectangle represents the number of devices in a site that are offline, and the color represents how many devices have gone offline in the configured period as a proportion of all devices. Clicking on a site in the widget allows you to drill down into a list of the offline devices for that site. For more information about actions you can perform on these devices, refer to Action buttons. NOTE OnDemand devices are not included in the offline device count. |
Select the recency of offline devices to display, enter a site limit, and select the device types. |
Offline Devices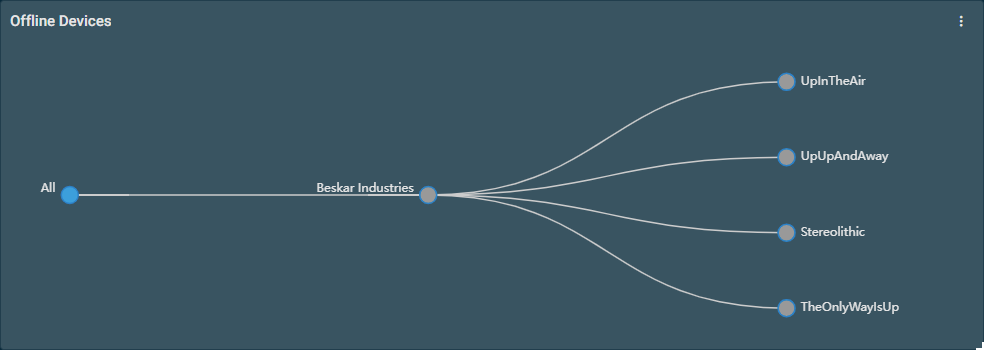 |
Tree | Shows a tree of offline ESXi hosts, servers, and network devices. The color of the node provides an indication of how recently the device went offline:
Hovering over the root node shows the count of child sites that have offline devices. Hovering over the site node shows the count of offline devices within the site. Clicking on the site or device nodes allows you to drill down into individual sites or individual devices. For more information about actions you can perform on these devices, refer to Action buttons. Clicking on the root note collapses the tree structure. NOTE OnDemand devices are not included in the offline device count. |
Select the recency of offline devices to display, enter a device limit, and select the device types to display. |
Recent Offline Devices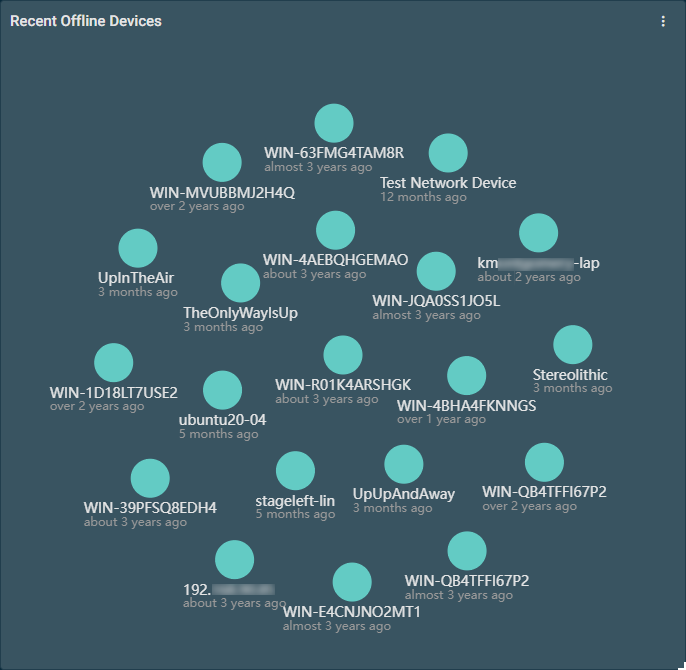 |
Graph force | Shows a graph force representation of offline ESXi hosts, servers, and network devices. Recently offline devices are represented as larger dots. Click on any of the dots to open the device summary page. Refer to Device summary. NOTE OnDemand devices are not included in the offline device count. |
N/A |
Windows Patch Status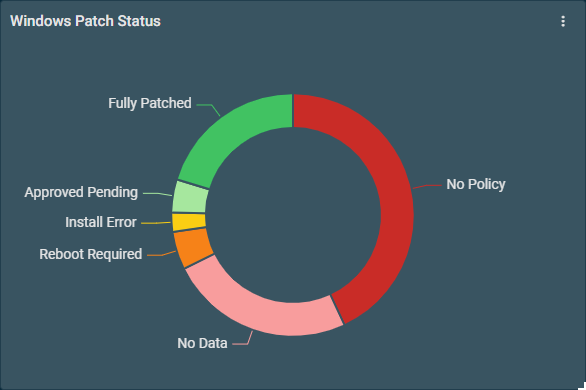 |
Doughnut | Shows a breakdown of Windows device patch statuses. The color of the doughnut section provides an indication of the patch status for those devices:
Clicking on a section of the doughnut allows you to drill down into a list of devices with the same patch status. |
N/A |
Antivirus Status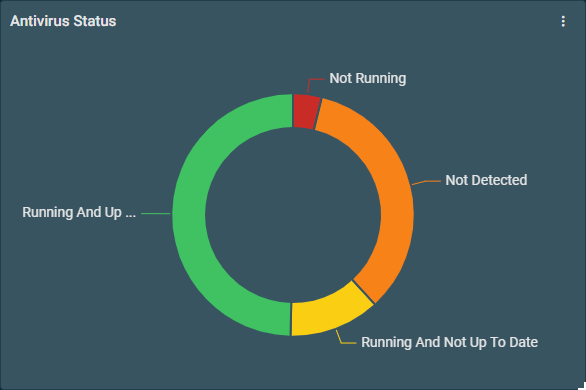 |
Doughnut | Shows a breakdown of antivirus status. Clicking on a section of the doughnut allows you to drill down into a list of devices with the same antivirus status. The color of the doughnut section provides an indication of the antivirus status for those devices:
|
N/A |
Notes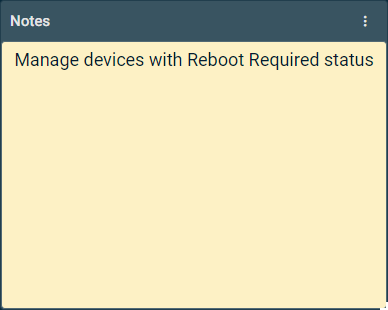 |
Text | Enter and save custom notes. | N/A |
Clock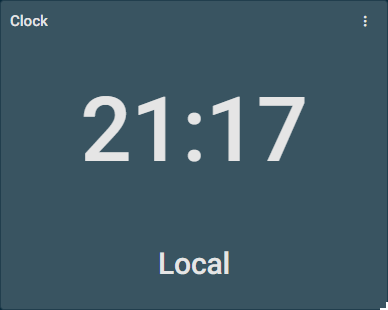 |
Clock | Displays the current time. |
Select a time zone and whether or not to display the time zone label. |
Alerts by Category (Open)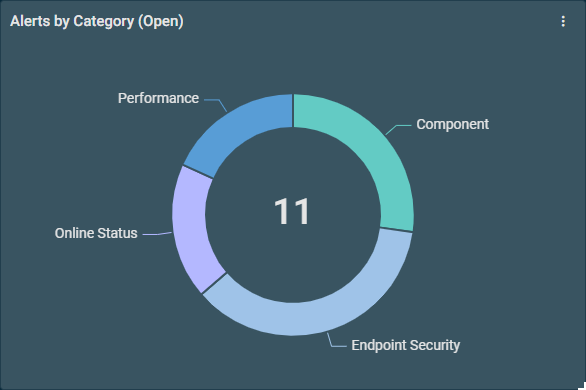 |
Doughnut | Shows a breakdown of the number of open alerts. Clicking on a section of the doughnut allows you to drill down into a list of alerts of the same category. From this list, you can resolve one or more alerts. You can also export all or selected rows to CSV. Refer to Alerts. NOTE In the Datto Endpoint Security Dashboard from the Dashboard Library, this widget is named Security Alerts by Category (Open). To learn how to obtain this pre-made dashboard, refer to Dashboards toolbar. |
Configure the recency of alerts to display and the alert categories. Select one of the following options: Last 24 Hours, Last 7 Days, Last 14 Days, Last 30 Days (default), Last 60 Days, Last 90 Days, or Last 180 Days. NOTE The Endpoint Security category is available only in the Datto Endpoint Security Dashboard. To learn how to obtain this pre-made dashboard, refer to Dashboards toolbar. |
Alerts by Priority (Open)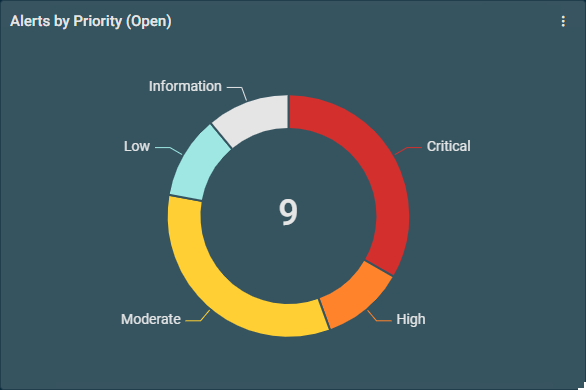 |
Doughnut | Shows a breakdown of the number of open alerts by priority. Clicking on a section of the doughnut allows you to drill down into a list of alerts with the same priority type. The color of the doughnut section provides an indication of the alert priority for those devices:
From this list, you can resolve one or more alerts. You can also export all or selected rows to CSV. Refer to Alerts. |
Configure the recency of alerts to display and the alert priorities. Select one of the following options: Last 24 Hours, Last 7 Days, Last 14 Days, Last 30 Days (default), Last 60 Days, Last 90 Days, or Last 180 Days. |
Recent Alerts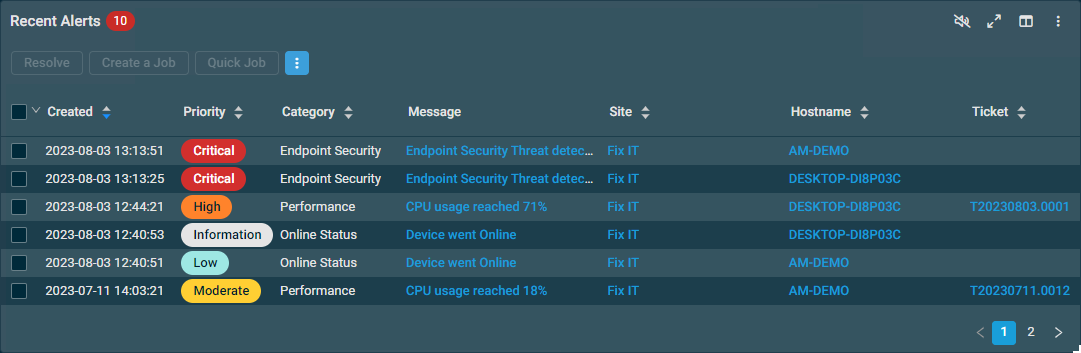 |
Table | Shows a tabular view of recent alerts. The table header has a badge showing the number of alerts. By default, the table displays open alerts created within the last 30 days. From this list, you can resolve one or more alerts. You can also export all or selected rows to CSV. Refer to Alerts. |
The following settings are available in the upper-right corner of the table:
|
Datto SaaS Protection Clients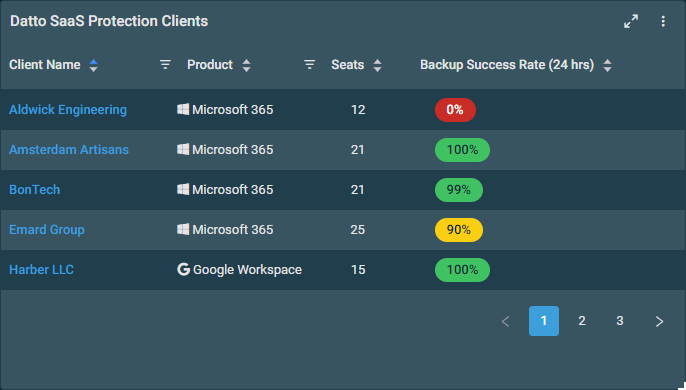 |
Table | Shows a tabular view of Datto SaaS Protection client data. For details, refer to Datto SaaS Protection Clients table widget. NOTE This widget is available only if the Datto SaaS Protection Integration is enabled. Refer to Datto SaaS Protection Integration. |
N/A |
Software Management Status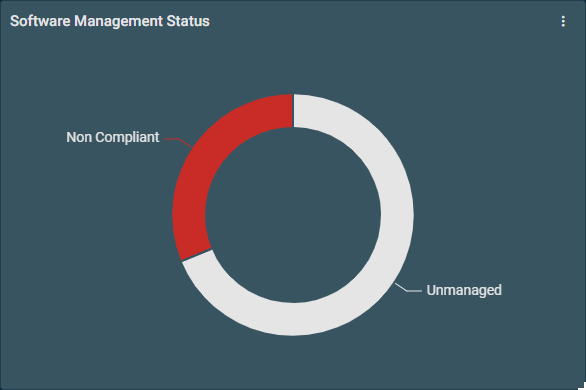 |
Doughnut | Shows a breakdown of software management status. The color of the doughnut section provides an indication of the software status for those devices:
Clicking on a section of the doughnut allows you to drill down into a list of devices with the same software management status. Refer to Software status. |
N/A |
Text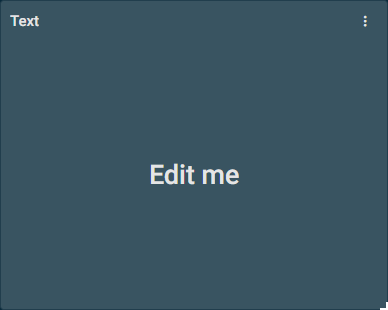 |
Text | Enter and save custom text, including the title of the widget. In full-screen mode, text editing will not be available, and the title will be hidden. | N/A |
IFrame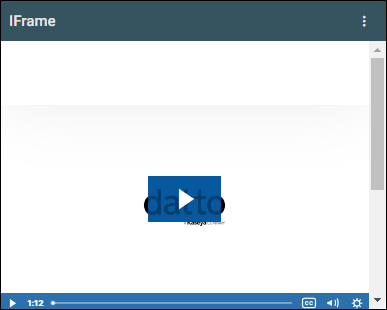 |
IFrame | Enter a secure (https://) URL and press Enter to view the embedded content. NOTE Not all websites allow IFrame embedding. A message will be displayed if the URL is not secure or contains special characters, prompting you to edit it. |
Add a URL, or replace or edit a URL after initial configuration. |
Datto Continuity Devices Local Storage Consumption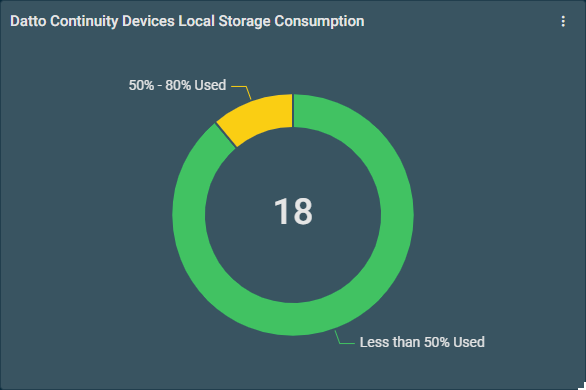 |
Doughnut | Shows the percentage of local storage used for each Datto Continuity device. The color of the doughnut section provides an indication of the storage percentage used for those devices:
Clicking on a section of the doughnut allows you to drill down into the widget to view the list of those devices with the following sortable columns: Hostname, Site, Local Storage Used, and Local Storage Available. NOTE Datto Backup for Microsoft Azure and Datto Endpoint Backup with Disaster Recovery devices are not shown. |
N/A |
Datto SaaS Protection Backup Success |
Doughnut | Shows the number of protected clients in the integrated Datto SaaS Protection account and an aggregated breakdown of their backup success rates. The color of the doughnut section provides an indication of the success rates:
Clicking on a section of the doughnut allows you to drill down into the widget to view the list of clients that meet the criteria. The table includes the following columns: Client Name (links to the client status page in Datto SaaS Protection), Product, Seats, and Backup Success Rate (24 hrs). All columns are sortable. This filtered table functions the same as the Datto SaaS Protection Clients widget. NOTE This widget is available only if the Datto SaaS Protection Integration is enabled. Refer to Datto SaaS Protection Integration. |
N/A |
Datto Continuity Backup Status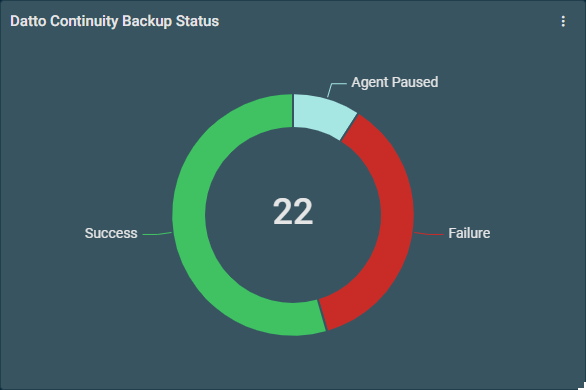 |
Doughnut | Shows the status of the latest backups taken of all protected devices. The color of the doughnut section provides an indication of the backup status:
Clicking on a section of the doughnut allows you to drill down into the widget to view the list of protected devices with the following columns: Hostname, Device (links to the Datto Continuity device protecting this device), Site, Last 10 Backups, Local Backup, Offsite Sync, and Screenshot Verification. All columns are sortable except for Last 10 Backups. NOTE Protected devices that use agentless backup are not shown. For details, refer to Status in the Protected Devices card. NOTE Datto Backup for Microsoft Azure and Endpoint Backup with Disaster Recovery devices are not shown. |
N/A |
Devices Under Maintenance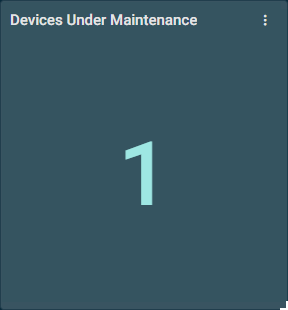 |
Statistics | Shows the number of devices currently in maintenance due to a Maintenance policy or unscheduled maintenance. Refer to Maintenance policy and Create a Maintenance Mode Window. Clicking on the number in the widget allows you to drill down into a list of devices in maintenance. For more information about actions you can perform on these devices, refer to Action buttons. |
N/A |
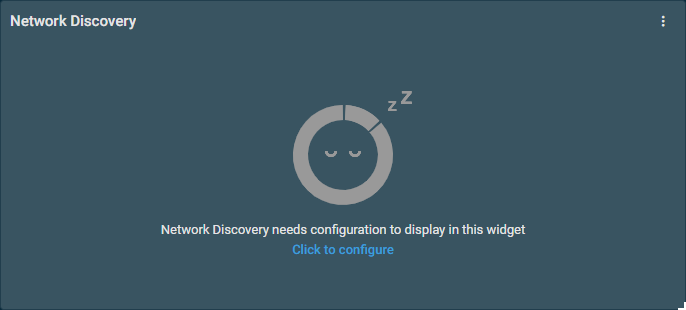
Network Discovery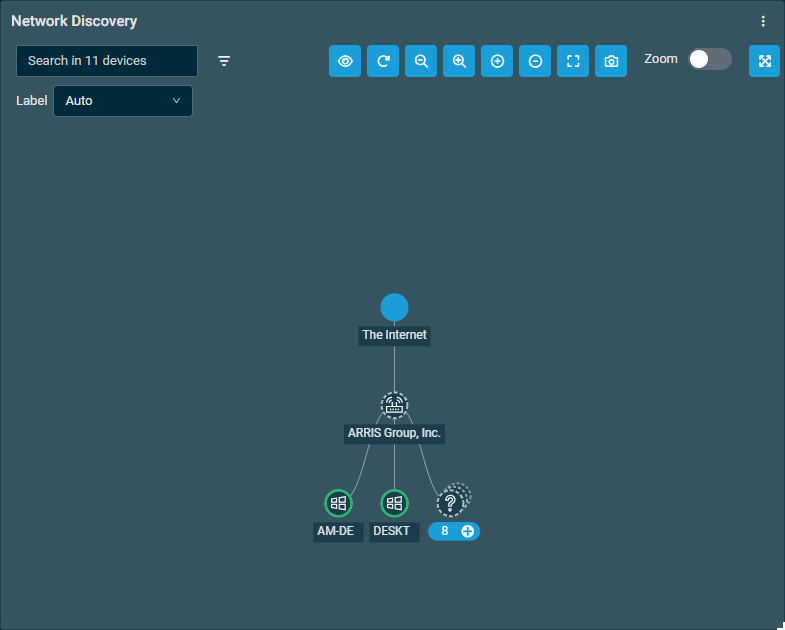 |
Topology map | Shows the network topology map for this site. For more information about the map and the actions that you can perform, refer to Network topology map. NOTE Clicking to enter full-screen mode from the widget will direct you to the Network Discovery page. To view data within this widget, the following prerequisites must be met:
|
N/A |
RocketCyber Status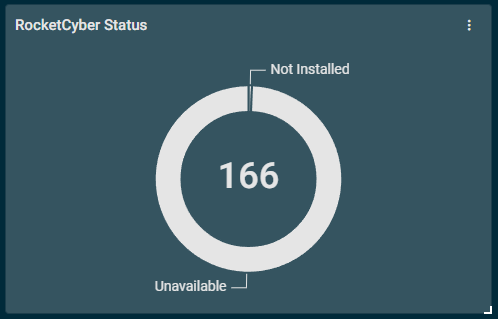 |
Doughnut | Shows a breakdown of RocketCyber status. Clicking on a section of the doughnut allows you to drill down into a filterable list of devices with the same RocketCyber status, with additional device actions available. The color of the doughnut section provides an indication of the RocketCyber status for those devices:
|
Select whether to display Active, Needs Attention, Isolated, Not Installed, or Unavailable statuses and whether to show labels in the widget. |


 allows you to select which columns should be visible in the list. Refer to
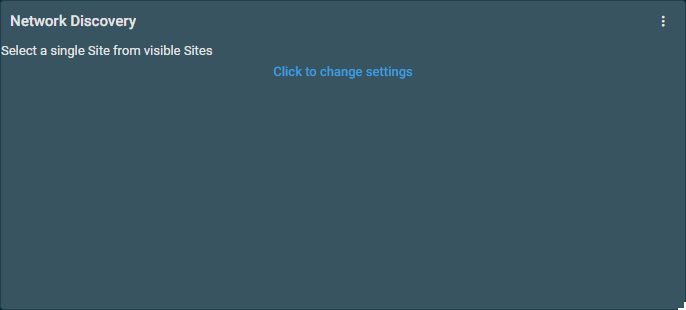
Refer to Security Threats in Widget types. The table displays the following information:
| Field | Sortable? | Description |
|---|---|---|
| Site |

|
Click the site name to open the Site summary page. |
| Datto EDR |
|
Displays the number of devices in the site that have a Datto EDR status of Inactive. Refer to Datto Endpoint Security in Endpoint Security policy. |
| Ransomware Detection |
|
Displays the number of devices in the site that have a Ransomware Detection status of Inactive. Refer to Ransomware Detection in Endpoint Security policy. |
| Windows Defender |
|
Displays the number of devices in the site that have a Managed Windows Defender Antivirus status of Inactive. Refer to Managed Windows Defender Antivirus in Endpoint Security policy. |
| Antivirus |
|
Displays the number of devices in the site that do not have an antivirus status detected. Refer to the Antivirus Status field in the Summary card. |
| Total |
|
Displays the total number of devices in the site. |
The table density is set to condensed theme by default. To change it to relaxed theme, click the density toggle icon.  The selection will persist across all pages.
The number of results displayed can be specified by selecting the desired number from the pagination control. This selection will persist the next time the page is accessed.
Adding a widget
Open the Widget Library by clicking the Add Widget button. Observe that the Widget Library opens.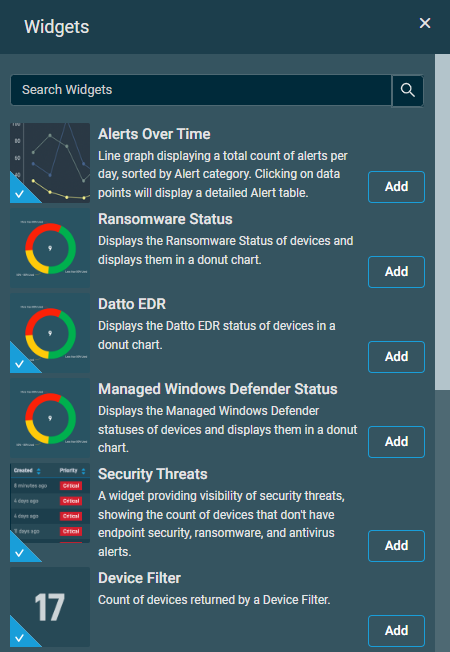
You may search for widgets by using the search bar at the top of the Widget Library.
Click Add to add a widget from the Widget Library to your dashboard. Once added to your dashboard, you can click and drag widgets to resize and rearrange them.
NOTE If a widget has already been added to your dashboard, a check mark appears next to the widget. However, you can add the same widget type multiple times.
NOTE A maximum number of 50 widgets can be added to a dashboard.
Widget settings
Some widgets contain configurable settings, as detailed in the Widget Settings column.
In the upper-right corner of an applicable widget, click the More icon and select Settings.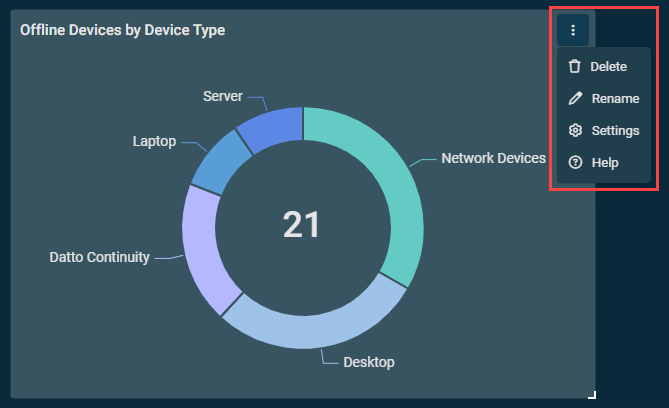
| Field | Description |
|---|---|
| Delete | Click Delete to remove this widget from the current dashboard. |
| Rename | Click Rename to make the name field for this widget editable. Enter the new name for the widget and press Enter on your keyboard. You can also rename a widget by clicking on the text at the top of the widget and entering a new name. The changes will be saved automatically. |
| Refresh | This option is available only for Device Filter widgets. Refer to Device Filter. The Device Filter widget data is automatically refreshed every five minutes. To initiate a manual refresh, click Refresh to immediately retrieve the most up-to-date data. |
| Settings | Click Settings to access settings that are specific to this widget type, if applicable. When you have finished configuring the widget, click Save to save your changes. NOTE Not all widgets have configurable settings. Refer to Widget types. |
| Help | Click Help to open this Help system page in a new browser tab. |


