Creating a custom component monitor
BEFORE YOU BEGIN Knowledge of the scripting language PowerShell or Batch is required. For scripting languages supported by Datto RMM, refer to Scripting.
PERMISSIONS Refer to Components > Components in Permissions.
PERMISSIONS Refer to Global > Policies in Permissions.
PERMISSIONS Refer to Sites > Policies in Permissions.
PERMISSIONS For ComStore policies, also refer to ComStore > ComStore in Permissions.
NAVIGATION Automation > Components > Create Component
NAVIGATION Policies > All
NAVIGATION Policies > click any policy type in the list
NAVIGATION Global > Policies
NAVIGATION Sites > All Sites > click the name of a site > Policies (left navigation menu)
NAVIGATION Device summary page > Policies card > click the full-screen icon. To view the various navigation paths you can use to access the device summary page, refer to Device summary.
About custom component monitors
Component monitors are, in essence, scripts that regularly run on a device. If the script detects that a specific condition is met, an alert can be raised that is then sent over to Datto RMM. One can find and download a number of pre-configured component monitors from the ComStore that cover various topics from security to networking. Refer to ComStore.
A case may arise in which no ComStore monitor exists to meet a specific need (for example, monitoring a particular piece of software or the contents of a specific registry value) and for which a custom component must be produced. Datto RMM can be used alongside existing scripting knowledge to produce a monitor that checks for a condition using the command-line and responds accordingly.
NOTE Datto RMM Support is unable to assist with queries regarding script writing. Contact your account manager about a charged Professional Services engagement if you would like a Datto employee to create or debug a script for you.
Component monitors can be any scripting language supported by the endpoints on which the monitor will be running. For Windows, this is generally PowerShell, whereas macOS and Linux devices use Bash. For more information, refer to Scripting.
How to...
In this exercise, we will write a PowerShell monitor script that looks for a text file called C:\Test\test.txt. If that file exists, the script will terminate with exit code 0; otherwise, it will exit with code 1. In all instances, the script will exit with a status so that Datto RMM can report on it.
NOTE Exit code 0 for success and 1 for failure is a standard enforced across all scripting languages and most command-line programs.
EXAMPLE You can see an example of a script with notes below.
If (test-path "C:\test\test.txt" -erroraction silentlycontinue) {
	write-host '<-Start Result->'
 	write-host "STATUS=File test.txt was present"
 	write-host '<-End Result->'
 	exit 0
} else {
	write-host '<-Start Result->'
 	write-host "STATUS=File test.txt was absent"
 	write-host '<-End Result->'
 	exit 1
}
Explanation
- If (test-path "file location") is a command that returns a Boolean based on the presence of a file at the path given. Since it will always return true or false, we can encase it with an if clause without needing to parse the output.
- We run this command with the ErrorAction flag set to SilentlyContinue. If we didn’t do this, the command would produce an error on a file’s absence. This is a specific requirement for this use case.
- The Start Result and End Result lines are necessary for component monitors to operate in Datto RMM. A monitor will not run without these parameters in the script.
- The first branch of the if clause concerns what to do if the result is true. A result of true in this case would mean the file was located, which we have decided not to alert on. As a result, we exit with code 0. However, we are still writing a result; this is so that the last state of the monitor will report as File test.txt was present instead of no data in Datto RMM.
- Output message:
IMPORTANT Notice how the output message begins with STATUS= and then continues with the message, with no space. This is important. Whether you use STATUS= or a different variable, the output message must include the equal sign and must not include a space character after the equal sign.
- The next branch concerns a false result which has a different message and exits with code 1. This will be interpreted by Datto RMM as an alert state.
EXAMPLE
Correct:
• "RESULT=Your message"
Incorrect:
• "RESULT= Your message"
• "Your message"
NOTE If your script performs differently when it is run locally compared to when it is run within Datto RMM, it may be due to permissions. Scripts run via quick jobs run as the most highly privileged user, which is NT AUTHORITY\SYSTEM for Windows devices and Root for macOS devices.
The alert given for a message cannot span more than a single line; however, diagnostic text can be added to an alert to give more context. An alert’s diagnostic block may simply contain an explanation of the alert’s importance. Alternatively, commands can be run within a diagnostic, with the output appearing as part of the alert.
EXAMPLE In the following example, we will add a diagnostic to our file not found alert that shows all the programs running in memory at the time of the alert being raised. You may want to do this to establish whether the program meant to be writing the file was running and stalled or had been quit unexpectedly. In the example script, new lines of code start with write-host '<-Start Diagnostic->'.
If (test-path "C:\test\test.txt" -erroraction silentlycontinue) {
	write-host '<-Start Result->'
 	write-host "STATUS=File test.txt was present"
 	write-host '<-End Result->'
 	exit 0
} else {
	write-host '<-Start Result->'
 	write-host "STATUS=File test.txt was absent"
 	write-host '<-End Result->'
 	write-host '<-Start Diagnostic->'
 	write-host "- Programs running in memory at alert time:"
 	get-process
 	write-host '<-End Diagnostic->'
 	exit 1
}
Explanation
- Note that the diagnostic must be posted before the exit.
- The lines encased with <> characters are written in single quotes so that the interpreter handles them literally. This is best practice as opposed to a requirement.
- There is no reason to post diagnostic text if you are exiting with code 0. No alert will be posted, so no diagnostic will be processed.
NOTE If you are integrating with Autotask, the diagnostic will be included in the ticket.
IMPORTANT Diagnostics can contain commands, as seen in the example, but all commands must finish and post data within 60 seconds of the alert state being triggered. Commands taking longer than this to process will be ignored. This is so that alerts are not held up unnecessarily.
To create a component monitor using the script you've written, follow these steps:
- Navigate to Automation > Components > Create Component.
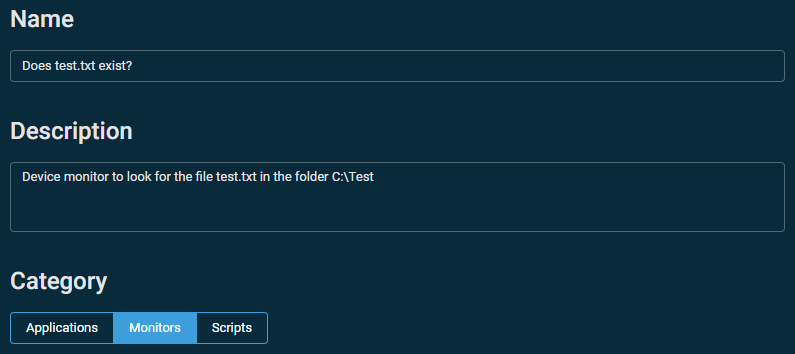
- Enter a Name and a Description.
- Select the category Monitors.
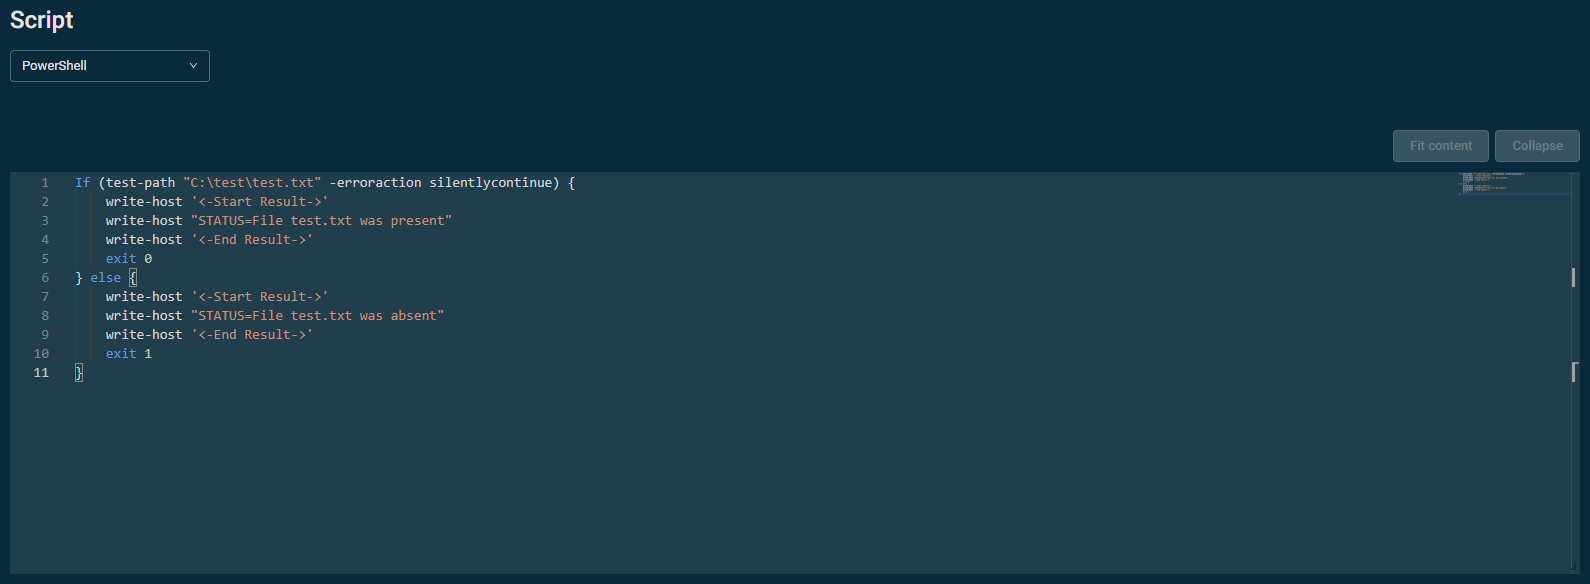
- Scroll down to the Script section and from the Script drop-down menu, select the language you wrote the script in. If you are testing the examples provided above, the language is PowerShell.
- Paste your working and tested script.
- Complete the additional fields as necessary and click Save. For help with these additional fields, refer to Creating a component. Your component monitor will be saved and added to your component list.
Now that you have a custom component monitor, the final step is to deploy it to one or more devices using a Monitoring policy. Refer to Monitoring policy and Component monitor.
When selecting the monitor type, choose Component, and then select your custom component monitor.
Complete the additional fields as necessary.
IMPORTANT When you edit a component that is used in a Monitoring policy, make sure to re-push the policy for the component changes to be applied.
If the file you are looking for does not exist on a device the monitor was pushed out to, the designated alert recipients will receive an email similar to this: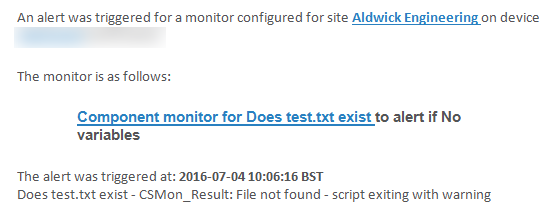
Refer to Alerts to learn how to see all raised alerts. For alert details, click the hyperlinked alert message in any list of alerts. Refer to Single Alert View.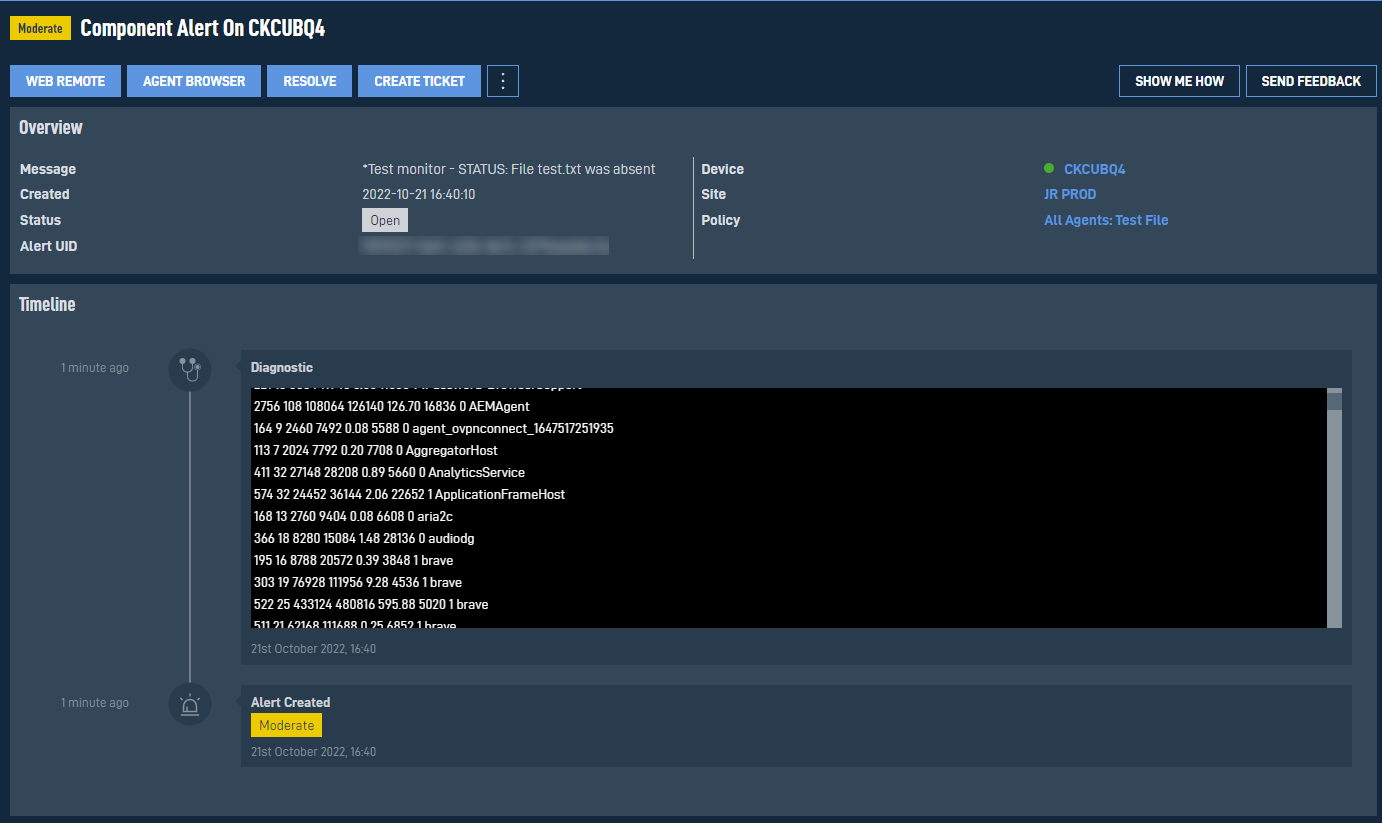
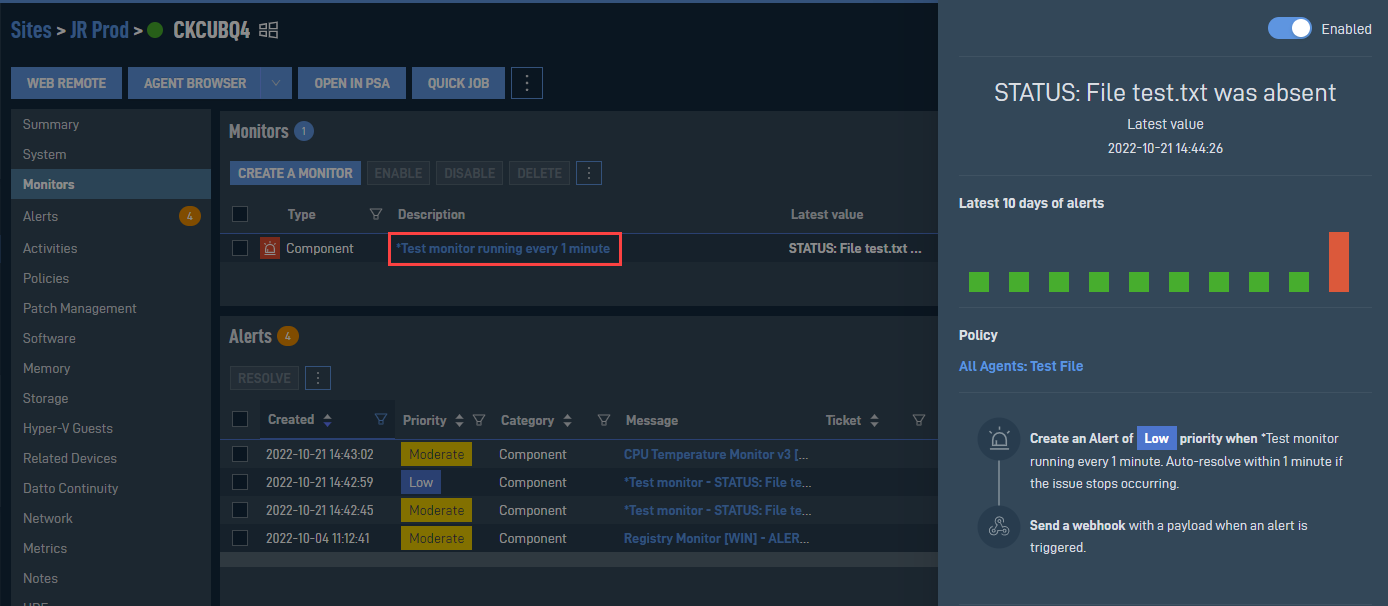
Navigate to the device summary page and click the monitor description to see the monitor details. Refer to Viewing monitor details.