Audits - Legacy UI
PERMISSIONS Refer to ACCOUNT > Audit and SITES > Audit in Security Level Details - Permissions
NAVIGATION Legacy UI > Account > Audit > Network / Hardware / Software / Licensing radio button
NAVIGATION Legacy UI > Sites > select a site > Audit > Network / Hardware / Software / Licensing radio button
NAVIGATION Legacy UI > Sites > select a site > Devices > select a device > Audit > Hardware / Software / Services / Change Log radio button
Refer to Audits.
About audits
An audit is an inventory of the hardware and software installed on a device as logged by the Datto RMM Agent. As consecutive audits are performed, changes to the hardware and software are tracked in a change log. The data is stored on the device and added to the device record in the Web Portal. Network discovery information is also displayed on the Audit tab. The following audit levels are available:
| Audit Level | Description |
|---|---|
| Account | View all sites' discovered devices in a table form. You can also see all hardware and software installed on the devices associated with all sites in the account, including quantity and version information. |
| Site | View the discovered devices in the site. You can also see all hardware and software installed on the devices associated with that particular site, including quantity and version information. |
| Device | View all hardware and software currently installed on that particular device. You can also see the status of the installed Windows services and the changes that have been made to the device over time. |
| Account and site | Monitor the number of devices a software package is installed on. This allows you to manage site or team licenses. You will receive an alert when you exceed the maximum number of devices. |
NOTE The Audit tab also includes an Activity Log section at the account and device levels. All activity logging is now available exclusively in the New UI. Refer to Activity Log and Device summary.
NOTE Global and site-level hardware and software lists are also available in the New UI. Refer to Software and Hardware.
A full audit is a complete inventory audit of a device taken at the time the Agent is installed, or when a network device is assigned a Network Node. A full audit of a device can also be initiated manually at any time.
A delta audit is a list of the changes to the audit information on the device since the last audit. Delta audits are performed automatically on a regular schedule but they can also be initiated manually.
Refer to Perform a manual audit in the legacy UI and Request Audit in the New UI.
IMPORTANT Device audits are rate limited. Only three audits may be performed per device over a five-minute time frame. This rate limiting applies to both full and delta audits.
| Agent Type / Device Type | Full Audits | Delta Audits |
|---|---|---|
| Managed devices | • Right after Agent installation • Manually when a single device is selected. Refer to Perform a manual audit in the legacy UI and Request Audit in the New UI. |
• Every 24 hours • Upon successful completion of a job • After all patches of a patch policy have been applied (or the patch window has expired). If the policy does not require the device to reboot or shut down, the device will audit immediately. If a reboot is required, the audit will run after the reboot. • Manually when multiple devices are selected. Refer to Perform a manual audit in the legacy UI and Request Audit in the New UI. |
| Network devices (including printers and ESXi hosts) | • When a device is assigned a Network Node • When the device's device type is updated • Manually • Every 24 hours |
N/A |
| OnDemand devices | • Right after Agent installation, and then once every seven days • When the OnDemand Agent has been activated by the end user |
N/A |
NOTE If a Network Node is assigned to a device that has an Agent installed, the Network Node will not audit the device, just perform monitoring against it.
Following a device audit, a patch scan is triggered by the events listed below:
- Patch Management policy has run
- Initial full audit (right after Agent installation)
- Regular audit every 24 hours
- Manual audit (when a single device or multiple devices are selected)
Note that a patch scan is not triggered by the following:
- Quick jobs
- Scheduled jobs
- Alert response components
- User tasks
For more information about the patch scan process, refer to Determining a device's patch status.
The Datto RMM Agent Service (CagService) logs audit messages in the Agent log files in the form of Audit reason: REASON (for example, Audit reason: REQUESTED_BY_PLATFORM). For information about the location of the log files, refer to Location of the log files in Agent log files.
The audit reasons the Datto RMM Agent sends to the platform are the following:
- REQUESTED_BY_PLATFORM
- SET_AS_NETWORK_NODE
- AFTER_REBOOT
- WMI_REPOSITORY_RESET
- INTERVAL
- AES_IN_PROTECTION_STATE
- PATCH_POLICY_AUDIT_ONLY
- AFTER_INSTALLING_PATCHES
- AFTER_AUTOMATIC_JOBS
- AFTER_JOB
How to...
IMPORTANT Device audits are rate limited. Only three audits may be performed per device over a five-minute time frame. This rate limiting applies to both full and delta audits.
- Navigate to your list of devices and select one or multiple devices.
- Click the Request device audit(s) icon
 and confirm that you want to perform the audit.
If you selected a single device, a full audit will be performed.
If you selected multiple devices, a delta audit will be performed.
Refer to Full and delta audits.
- Navigate to Account > Audit OR Sites > select a site > Audit.
- At the top of the page, on the right-hand side, you will see the following radio buttons: Network, Hardware, Software, Licensing, Activity Log.
NOTE The Activity Log section, which points to the New UI, is only available at the account level.
The result of the network scan carried out by Network Nodes is displayed under the Audit > Network radio button. To learn about network discovery, refer to Network scan process and De-duplication of discovered devices in the legacy UI and Network Discovery in the New UI.
The table below details the information available as a result of network discovery at both the account and site level.
Account Level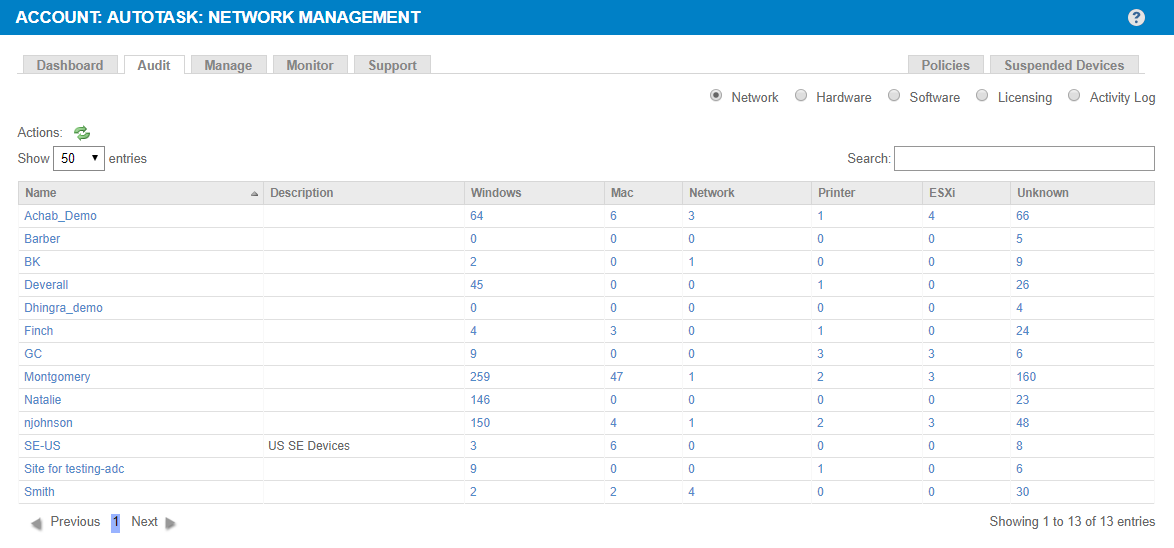 |
|
|---|---|
| Field | Description |
| Actions | |
| Show entries | Select to show 10 / 25 / 50 / 100 entries per page. |
| Search | A dynamic search field. As you type, the search results are narrowed to match your search string. |
| Name | Displays the name of the site where devices have been discovered. Click the hyperlink to be directed to the Site summary - Legacy UI page. |
| Description | Displays the description of the site. |
| Windows | Displays the device type of the discovered devices. Click a number to be directed to that device type group on the Audit tab of that site. The group will automatically be expanded at the site level. |
| Mac | |
| Network | |
| Printer | |
| ESXi | |
| Unknown | |
| Previous / Next | Click Previous / Next to see the previous or next page of results. |
| Sort | Click the column header of any of the columns to sort the information by that column. |
Site Level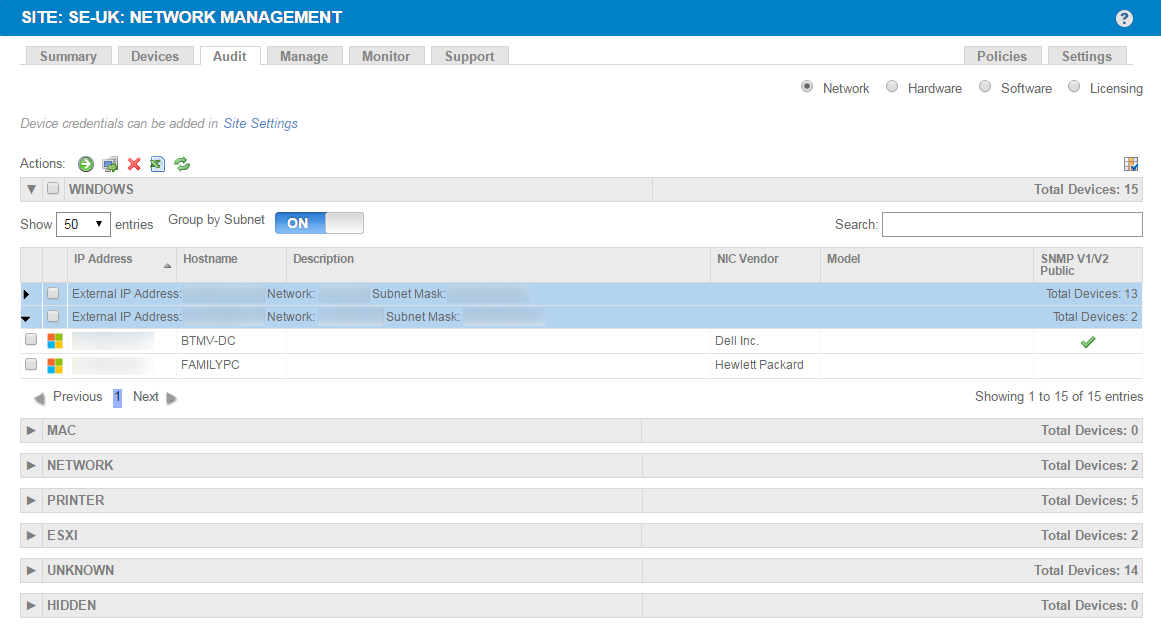 | |
| Field | Description |
| Actions | • • • • NOTE Microsoft Excel is unable to properly display UTF-8 compliant CSV files when they contain non-English characters. • |
| Column Chooser | The Column Chooser allows you to select which columns should be visible in the list. TIP Choose the Last Seen By option in the Column Chooser to see which Network Node device last discovered the device. |
| Windows | The list of network devices discovered by one or more Network Node devices in a site. The discovered devices are grouped into various device types. Expand any of the groups to have access to more information. See the description of the default fields below. NOTE The "Hidden" group exists only to contain devices that have been manually placed there. Use this group to hide devices that you don't want to manage or see in future network scans. Devices can be moved out of this group at any time. |
| Mac | |
| Network | |
| Printer | |
| ESXi | |
| Unknown | |
| Hidden | |
| Selection check box | Click the check box in the header row of a group to select all rows, or click one or more rows to perform an action. NOTE The selection check box in the header row of a group will only become visible once the group has been expanded at least once. It will remain visible even after the group is collapsed again. |
| Total Devices | The total number of devices in one group or subnet is displayed on the right of each group. |
| Show entries | Select to show 10 / 25 / 50 / 100 entries per page. |
| Group by Subnet | If a Network Node device moves between networks frequently, it will discover devices in a number of different subnets. To keep the list of discovered devices organized, you can turn on the Group by Subnet option. An additional blue row will display further information about the subnet (External IP Address, Network, Subnet Mask). You can collapse or expand the subnet groups as required. NOTE Audit data that exceeds 255 characters will be truncated and the truncated value will be saved. |
| Search | A dynamic search field. As you type, the search results are narrowed to match your search string. |
| Device icon | The discovered devices are flagged with their corresponding device icon. |
| IP Address | The internal IP address of the device. NOTE Audit data that exceeds 255 characters will be truncated and the truncated value will be saved. |
| Hostname | The name of the device. This can be edited in the device itself. |
| Description | The description of the device that can be edited in Device summary - Legacy UI. NOTE Audit data that exceeds 255 characters will be truncated and the truncated value will be saved. |
| NIC Vendor | The name of the vendor of the device. |
| Model | The model of the device. |
| SNMP v1/v2 Public | A green check mark |
| Previous / Next | Click Previous / Next to see the previous or next page of results. |
| Sort | Click the column header of any of the columns to sort the information by that column. |
At the site level, expand the Managed Devices or Unmanaged Devices section.
| Field | Description |
|---|---|
| Make/Model | Shows the complete list of hardware models. To see a list of devices that belong to a model, click the hyperlink. |
| Quantity | Shows the number of devices of a particular model. |
| Search | A dynamic search field that lets you search for models. As you type, the search results are narrowed to match your search string. |
| Show entries | Select to show 10 / 25 / 50 / 100 entries per page. |
| Previous / Next | Click Previous / Next to see the previous or next page of results. |
| Export to CSV |
Allows you to export a list of all models in .CSV format. Make sure to select/clear the columns you want to include/exclude in the export. NOTE Microsoft Excel is unable to properly display UTF-8 compliant CSV files when they contain non-English characters. |
| Refresh |
Refreshes the current view. This will show the devices' most up-to-date status. |
At the account level, click the Click here to load the software list for this account link.
This area allows you to monitor software licenses to alert you when the number of devices the software package is installed on exceeds a set threshold. Refer to Enable monitoring of software licenses.
| Field | Description |
|---|---|
| Software Package | The name of the software package. Click the hyperlink to view or edit it. |
| Items in Package | The number of software applications in the package. |
| Quantity Across Devices/Quantity | The quantity of software applications found on devices. |
| Alert | The software license threshold. Click the number to set the maximum number of licenses so that you can be notified when the threshold is reached. |
IMPORTANT All activity logging is now available exclusively in the New UI. Refer to Activity Log.
- Navigate to Sites > select a site > Devices > select a device. The device summary page will open.
- Click the Audit tab.
- At the top of the page, on the right-hand side, you can select any of the following radio buttons: Hardware, Software, Services, Change log, Activity Log.
NOTE Network devices and printers only have the Activity Log section available. The Activity Log section now points to the New UI.
NOTE ESXi hosts only have the Hardware and Activity Log sections available, which points to the New UI. The Activity Log section now points to the New UI.
This area displays various sections and fields within the sections, depending on the Datto RMM device type.
Hover over the Actions button to perform various actions on the device. For further information, refer to Action bar icons.
Hover over the Remote Actions button to take a screenshot of the device or connect to it . For more information, refer to Remote Actions.
If your Datto RMM account is integrated with Autotask, you will see one of the following buttons to the right of the Remote Actions button:
| Button | Description |
|---|---|
|
|
This button is displayed if the Autotask Integration is enabled and the Datto RMM device is synced to Autotask. Click the button to access the mapped configuration item in Autotask in a new browser tab. If you were already logged in to Autotask or single sign-on is configured for you, you will be directed to the configuration item page. If you are not logged in to Autotask, you will be required to enter your login credentials first. For more information, click the question mark icon in the upper-right corner of the Autotask page. You will automatically be directed to the appropriate topic in the Autotask Help system. |
| Device not synced | This button is displayed if the Autotask Integration is enabled but the Datto RMM device is not mapped to any configuration item in Autotask. |
NOTE If the Autotask Integration is not set up or is disabled, no button will be displayed. For information about the integration, refer to Autotask Integration.
IMPORTANT The Mobile Device Management (MDM) feature is no longer available. For more information, refer to this Kaseya Community post.
| Field | Server/Desktop/Laptop | ESXi Host | (Deprecated) Mobile Device |
|---|---|---|---|
| Hostname | ● | ● | ● |
| Description | ● | ● | ● |
| Operating System | ● | ● | ● |
| Service Pack | ● | ||
| Architecture | ● | ||
| Hyper-V Version1 | ● | ||
| .NET Version | ● | ||
| Domain | ● | ||
| Last Reboot | ● | ||
| IMEI | ● |
1 Only displayed for Hyper-V-enabled devices.
| Field | Server/Desktop/Laptop | ESXi Host |
|---|---|---|
| Disk Drive | ● | |
| Drive Type | ● | |
| Size | ● | |
| Free1 | ● | |
| Description | ● | |
| Data Store | ● | |
| Storage | ● | |
| File System | ● | |
| Capacity | ● | |
| Free | ● | |
| Subscription2 | ● | |
| Status | ● |
1 On macOS devices with an APFS partition (container), each APFS volume's available disk space is presented as the available disk space in the container (that is, the total size of the container minus the size of all volumes in the container). (Source: macOS support)
The free disk space calculation Datto RMM uses for macOS devices differs from Apple's approach, therefore, the number shown in the Datto RMM Web Portal is different from what is shown on the macOS device. The Datto RMM Agent sends the information about the number of free bytes to the platform, and the platform divides that by 1024*1024*1024 to get a number in GB. Apple, however, divides the same number of free bytes by 1000*1000*1000 to get a number in GiB.
2 Refer to A note on Subscription.
IMPORTANT The Mobile Device Management (MDM) feature is no longer available. For more information, refer to this Kaseya Community post.
| Field | Server/Desktop/Laptop | ESXi Host | (Deprecated) Mobile Device |
|---|---|---|---|
| Agent Version | ● | ||
| ID | ● | ● | |
| Last Seen | ● | ● | ● |
| Create Date | ● | ● | |
| Enrollment Date | ● | ||
| Last Audit Date | ● | ● | ● |
| Last Autotask Sync Date1 | ● | ● | ● |
| Last Autotask Verify Date1 | ● | ● | ● |
1 Only displayed if the device is mapped to an Autotask configuration item.
| Field | Server/Desktop/Laptop | (Deprecated) Mobile Device |
|---|---|---|
| Manufacturer | ● | ● |
| Model | ● | ● |
| Serial Number | ● | |
| Motherboard | ● | |
| Processor | ● | |
| Physical Cores | ● | |
| Memory | ● | |
| Display Adapter | ● | |
| Monitors | ● | |
| BIOS Name | ● | |
| BIOS Version | ● | |
| BIOS Release Date | ● | |
| Power Rating | ● | |
| ICCID | ● | |
| Operator | ● | |
| Number | ● |
| Field | Server/Desktop/Laptop | ESXi Host | (Deprecated) Mobile Device |
|---|---|---|---|
| Adapter | ● | ● | ● |
| MAC Address | ● | ● | ● |
| Speed | ● | ● |
| Field | ESXi Host |
|---|---|
| Name | ● |
| Speed | ● |
| Total Cores | ● |
| Field | Server/Desktop/Laptop | ESXi Host |
|---|---|---|
| Internal IP Address | ● | ● |
| Ext IP Address | ● | ● |
| Additional IP(s) | ● |
NOTE Limited information is displayed if the virtual machine doesn't have a Datto RMM Agent installed. For the Hostname and Status columns to be populated, ESXi guests require an RMM Agent to be installed from the same site the ESXi host and Network Node reside in.
| Field | ESXi Host |
|---|---|
| Hostname | ● |
| Guest Name | ● |
| Operating System | ● |
| Data Store | ● |
| CPU | ● |
| RAM | ● |
| Snapshots | ● |
| Field | Server/Desktop/Laptop | ESXi Host |
|---|---|---|
| Module | ● | ● |
| Type | ● | ● |
| Part Number | ● | ● |
| Serial Number | ● | ● |
| Capacity | ● | ● |
| Speed | ● | ● |
| Field | Server/Desktop/Laptop |
|---|---|
| Type | ● |
| Name | ● |
| Driver Name | ● |
| Driver Manufacturer | ● |
| Driver Version | ● |
| Driver File | ● |
| Driver File Last Modified | ● |
| Port Name | ● |
| Field | Description |
|---|---|
| Software | Shows all software installed on the device. |
| Version | Indicates the version of the software installed. IMPORTANT In this list, it may take up to 24 hours to show up-to-date versions of software installed via Software Management. |
| Search | A dynamic search field that lets you search for software installed on the device. As you type, the search results are narrowed to match your search string. |
| Show entries | Select to show 10 / 25 / 50 / 100 entries per page. |
| Previous / Next | Click Previous / Next to see the previous or next page of results. |
| Export to CSV |
Allows you to export a list of the software installed on the device in .CSV format. Make sure to select/clear the columns you want to include/exclude in the export. NOTE Microsoft Excel is unable to properly display UTF-8 compliant CSV files when they contain non-English characters. |
| Refresh |
Refreshes the current view. This will show the device's most up-to-date status. |
NOTE Services information is only displayed for Windows devices.
| Field | Description |
|---|---|
| Display Name | The display name of the Windows service. |
| Service Name | The abbreviated name of the Windows service. |
| Status at the last audit | The status of the Windows service at the last audit. |
| Startup Type | The startup type of the Windows service. |
| Search | A dynamic search field that lets you search for Windows services on the device. As you type, the search results are narrowed to match your search string. |
| Show entries | Select to show 10 / 25 / 50 / 100 entries per page. |
| Previous / Next | Click Previous / Next to see the previous or next page of results. |
| Export to CSV |
Allows you to export a list of the Windows services on the device in .CSV format. Make sure to select/clear the columns you want to include/exclude in the export. NOTE Microsoft Excel is unable to properly display UTF-8 compliant CSV files when they contain non-English characters. |
| Refresh |
Refreshes the current view. This will show the device's most up-to-date status. |
| Field | Description |
|---|---|
| System Changes | Shows system-level changes, along with the date when it occurred. |
| Software Changes | Shows any software that has been added or deleted, along with the version and the date when it occurred. |
| Hardware Changes | Shows any hardware changes, along with the date when it occurred. |
| Refresh |
Refreshes the current view. This will show the device's most up-to-date status. |
A change log is also available from the System card on the device summary page in the New UI. Refer to Change Log.
IMPORTANT All activity logging is now available exclusively in the New UI. Refer to Device summary.
- Navigate to Account > Audit OR Sites > select a site > Audit and click the Licensing radio button.
- On the Actions row, click the Manage account package (account level) or the Manage package (site level) icon
 .
. - If you are at the Account level, proceed to the next step.
At the Site level, a pop-up window will open. Click New Package....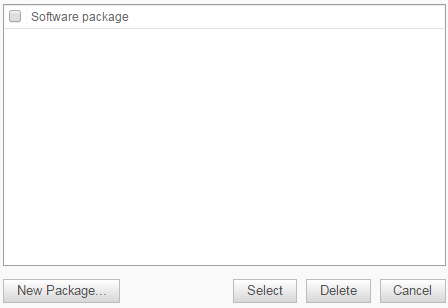
NOTE To create packages, you must have Manage permissions to the Audit tab on both the account and site levels, as well as View permissions for sites and Device Visibility for the site in question. If you want to delete packages as well as create them, you will need Manage permissions for sites.
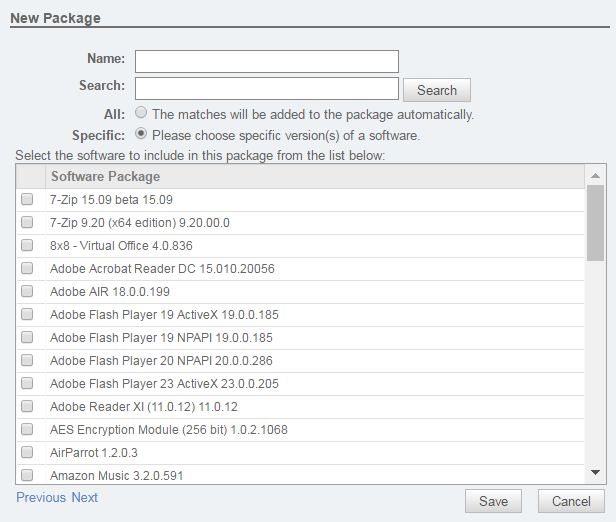
- Enter the following information and select the required applications:
| Field | Description |
|---|---|
| Name | The name you will save this search under. |
| Search | Enter a keyword or search string, then click Search. |
| All | If you check this radio button, all applications will be selected and the check boxes will be disabled. All results will be added to the software package. |
| Specific | If you check this radio button, the check boxes will be enabled, and you can select specific versions or products to add to the package. |
- Use the Previous and Next buttons under the list of applications to navigate to the previous or next page in the list.
- Once you have selected the required software, click Save. The window will close, and you will be returned to the Licensing page.
NOTE The available software selections are populated by audit data from devices in the site. It is not possible to add additional selections. It is recommended to select only one item per package to see if you have reached your limit of allotted licenses, since you are tracking the number of installed copies of that software. In some cases, however, the same software may appear differently (for instance if you had 32-bit and 64-bit versions that shared the same pool of licenses). In this case, you may want to select multiple software items for the same package.
- You will see the following information:
| Level | Information |
|---|---|
| Account level | • Software Package - The name of the software package. • Items in Package - The number of applications in the software package. • Quantity Across Devices - The quantity of software applications found in the account. NOTE While you can see how many copies of software in a package are installed across all devices, you cannot set an account-wide alert value. The alert value can only be set at the site level. |
| Site level | • Software Package - The name of the software package. • Quantity - The quantity of software applications found in the site. • Alert - The maximum number of licenses. Click the number or on Click to set if no threshold has been set before, and enter a number so that the default contact(s) for the site can be notified via email when the threshold is reached. The notification email is sent once every day until the issue is resolved, that is, until the package quantity is below the alert threshold again. You may want to set the alert value lower than the total license allotment, so you have time to order additional licenses before the allotment is reached. NOTE The alert does not appear in the Web Portal and cannot be resolved manually. |
- To add a software package created at the account level to one of your sites, click the Manage package icon at the site level. Check the check box next to the account-level software package and click Select.
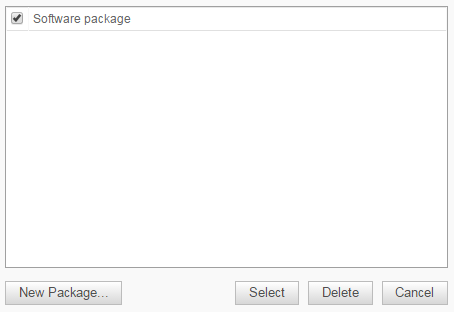
- The selected software package will now appear on the list at the site level.
