Device summary - Legacy UI
PERMISSIONS Refer to SITES > Devices in Security Level Details - Permissions
NAVIGATION Legacy UI > Sites > select a site > Devices > select a device > Summary
Refer to Device summary.
About
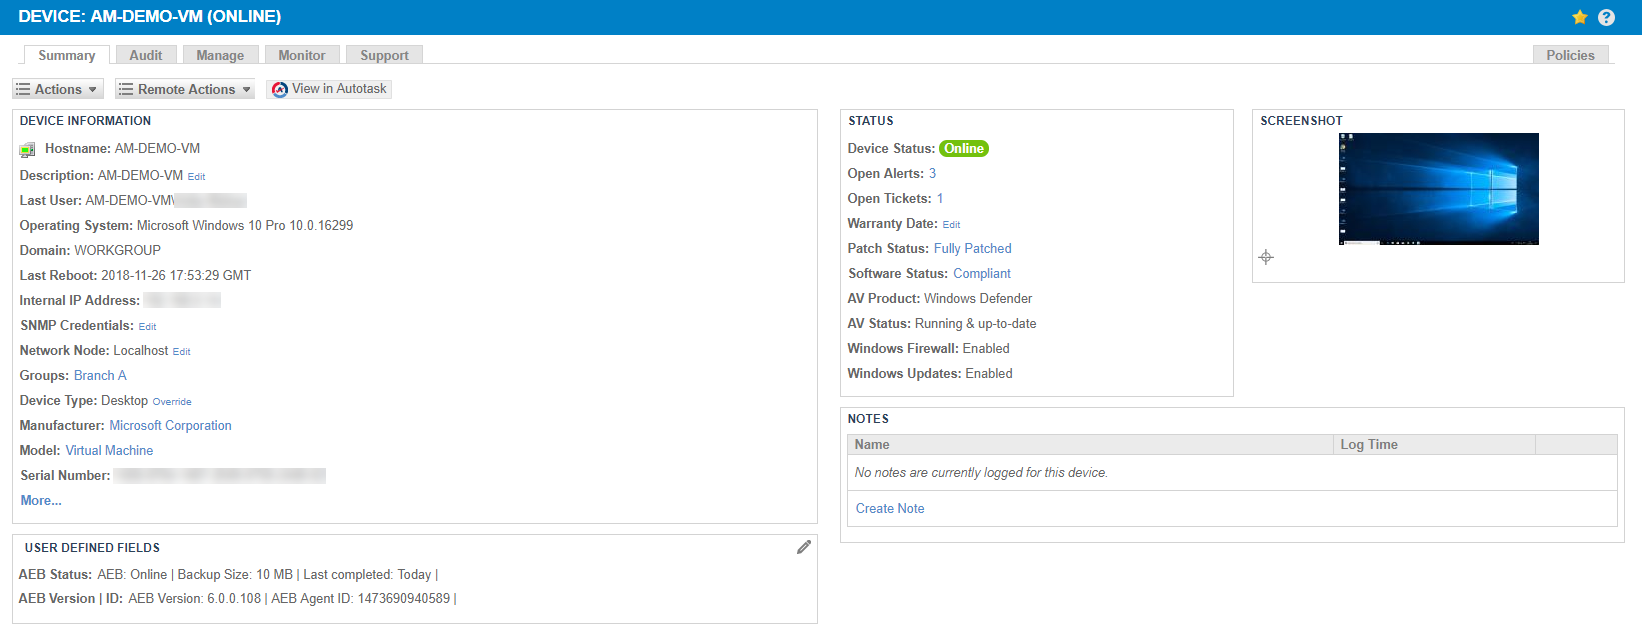
The device summary page displays a summary of the device, including operating system, IP addresses, user-defined fields, device status, and lots more.
IMPORTANT Depending on the device type, some information or sections on this page may not be available for the device.
Hover over the Actions button to perform various actions on the device. For further information, refer to Action bar icons.
Hover over the Remote Actions button to take a screenshot of the device or connect to it. For more information, refer to Remote Actions.
If your Datto RMM account is integrated with Autotask, you will see one of the following buttons to the right of the Remote Actions button:
| Button | Description |
|---|---|
|
|
This button is displayed if the Autotask Integration is enabled and the Datto RMM device is synced to Autotask. Click the button to access the mapped configuration item in Autotask in a new browser tab. If you were already logged in to Autotask or single sign-on is configured for you, you will be directed to the configuration item page. If you are not logged in to Autotask, you will be required to enter your login credentials first. For more information, click the question mark icon in the upper-right corner of the Autotask page. You will automatically be directed to the appropriate topic in the Autotask Help system. |
| Device not synced | This button is displayed if the Autotask Integration is enabled but the Datto RMM device is not mapped to any configuration item in Autotask. |
NOTE If the Autotask Integration is not set up or is disabled, no button will be displayed. For information about the integration, refer to Autotask Integration.
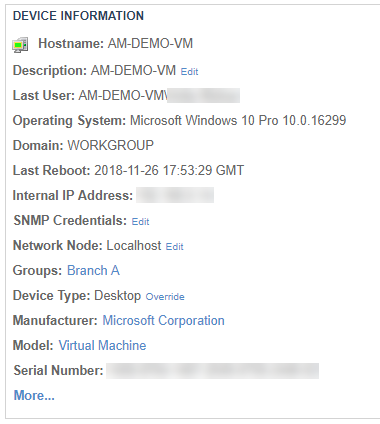
The fields displayed in this section vary depending on the device type.
To see more device details of Agent devices, ESXi hosts and mobile devices, click More... at the bottom of the Device Information section. This will direct you to the device's Audit tab. Refer to View audit data at the device level.
IMPORTANT The Mobile Device Management (MDM) feature is no longer available. For more information, refer to this Kaseya Community post.
| Field | Server/Desktop/Laptop | ESXi Host | Network Device | Printer | (Deprecated) Mobile Device |
|---|---|---|---|---|---|
| Hostname |
|
|
|
|
|
| Description |
|
|
|
|
|
| ID |
|
|
|||
| NIC Vendor |
|
|
|||
| SNMP Name |
|
|
|||
| SNMP Description |
|
|
|||
| SNMP Location |
|
|
|||
| SNMP Contact |
|
|
|||
| SNMP Uptime |
|
|
|||
| Create Date |
|
|
|||
| Last User |
|
||||
| Operating System |
|
|
|
||
| Domain |
|
||||
| Last Reboot |
|
||||
| Last Audit Date |
|
|
|||
| Last Autotask Sync Date |
|
|
|||
| Last Autotask Verify Date |
|
|
|||
| Internal IP Address |
|
|
|
|
|
| Ext IP Address |
|
|
|
||
| MAC Address |
|
|
|||
| ESXi Credentials |
|
||||
| SNMP Credentials |
|
|
|
|
|
| Network Node |
|
|
|
|
|
| Last Seen |
|
||||
| Enrollment Date |
|
||||
| Groups |
|
|
|
|
|
| Device Type |
|
|
|
|
|
| Manufacturer |
|
|
|
|
|
| Model1 |
|
|
|
|
|
| Serial Number1 |
|
|
|||
| Power Rating |
|
|
|
||
| Service / Asset Tag |
|
||||
| Snapshots |
|
||||
| Object ID |
|
|
|||
| Printed Page Count |
|
||||
| GPS Latitude |
|
||||
| GPS Longitude |
|
||||
| GPS Last Update |
|
1 In the case of network devices, these two values are only displayed for Cisco devices.
Depending on the device type, some device information can be updated manually.
IMPORTANT The Mobile Device Management (MDM) feature is no longer available. For more information, refer to this Kaseya Community post.
| Field | Server/Desktop/Laptop | ESXi Host | Network Device | Printer | (Deprecated) Mobile Device |
Description |
|---|---|---|---|---|---|---|
| Hostname |
|
|
|
Click Edit to update the device's hostname, then click Save. | ||
| Description |
|
|
|
|
|
Click Edit to update the device's description, then click Save. NOTE This field has a limit of 255 characters. TIP You can also have the Agent update the device's Description field. The process is identical to the one used for UDF data update. For more information, refer to Populate UDF information by the Agent. |
| Internal IP Address |
|
|
|
Click Edit to update the device's internal IP address, then click Save. | ||
| ESXi Credentials |
|
Click Edit and select the correct ESXi credentials from the list, then click Save. Site-level ESXi credentials will be displayed in addition to ESXi credentials specified in Account Settings, unless this option is disabled in Site Settings. For information on how to store ESXi credentials, refer to Account Settings - Legacy UI and Site Settings - Legacy UI in the legacy UI and ESXi credentials in the New UI. |
||||
| SNMP Credentials |
|
|
|
|
Click Edit and select the correct SNMP credentials from the list, then click Save. Site SNMP credentials will be displayed in addition to SNMP credentials specified in Account Settings, unless this option is disabled in Site Settings. You can also choose any of the Default SNMP Credentials (v1 and v2c, public) listed here. In case the SNMP credentials set in Account Settings or Site Settings are deleted, the Default SNMP Credentials will be used automatically. For information on how to store SNMP credentials, refer to Account Settings - Legacy UI and Site Settings - Legacy UI in the legacy UI and SNMP credentials in the New UI. |
|
| Network Node |
|
|
|
|
Click Edit and select a Network Node from the list, then click Save. All Network Nodes of the site that the device belongs to are displayed. Devices that can have an Agent installed also have an option called Localhost because these devices will attempt and be able to monitor themselves. When Localhost is selected on a Windows device, the Agent will use the 127.0.0.1 loopback address (instead of the Internal IP Address). Devices that cannot have an Agent installed and therefore cannot monitor themselves will have an option called Unassigned. For more information about Network Nodes, refer to Network discovery - Legacy UI. NOTE When you move a device to a different site in the legacy UI, the device's association to its Network Node will be cleared. For more information, refer to Moving devices to another site. |
|
| Device Type1 |
|
|
|
Click Override and select a device type, then click Save. The following device types can be selected for servers, desktops, laptops, and mobile devices: • Unknown • Automatic • Desktop • Laptop • Server • Smartphone (Android) • Smartphone (Blackberry) • Smartphone (iPhone) • Smartphone (iPod Touch) • Tablet (Android) • Tablet (iPad) • Tablet (PlayBook) IMPORTANT The Mobile Device Management (MDM) feature is no longer available. For more information, refer to this Kaseya Community post. The following device types can be selected for network devices: |
||
| Power Rating |
|
|
|
Click Edit to update the device's power rating, then click Save. For further information, refer to the Power Rating section in Account Settings - Legacy UI and Site Settings - Legacy UI. | ||
| Warranty Date (in the Status section) |
|
|
|
|
|
This field is not populated automatically. Click Edit to update the device's warranty date. Select the date (YYYY-MM-DD), click Done, and finally, click Save. NOTE Alternatively, you may consider using a third-party integration to populate this field. NOTE If the Autotask Integration is enabled, manual edits to the Warranty Expiration date will be synchronized to Autotask; however, removing the Warranty Expiration date in Datto RMM will not be synchronized to Autotask. If the Warranty Expiration date in Datto RMM is edited through an automatic method (for example, via a third-party integration), the change will only be synchronized if the Warranty Expiration field is empty in Autotask. NOTE If the ConnectWise PSA Integration is enabled, the Warranty Expiration date will only be synchronized to ConnectWise PSA if it is not in ConnectWise PSA at the time of the initial synchronization. If a Warranty Expiration date has already been set within ConnectWise PSA, it will not be updated upon subsequent device synchronization with Datto RMM. |
1 The device type of ESXi devices and printers cannot be overridden. Incorrectly assigned devices should be deleted and re-added.
The fields displayed in this section vary depending on the device type.
IMPORTANT The Mobile Device Management (MDM) feature is no longer available. For more information, refer to this Kaseya Community post.
| Field | Server/Desktop/Laptop | ESXi Host | Network Device | Printer | (Deprecated) Mobile Device |
|---|---|---|---|---|---|
| Device Status1 |
|
|
|
|
|
| Open Alerts2 |
|
|
|
|
|
| Open Tickets3 |
|
|
|
|
|
| Warranty Date4 |
|
|
|
|
|
| Patch Status5 6 |
|
||||
| Software Status7 |
|
||||
| AV Product8 |
|
||||
| AV Status8 |
|
||||
| Windows Firewall5 |
|
||||
| Windows Updates5 |
|
1 The Mobile Device Management (MDM) feature is no longer available. For more information, refer to this Kaseya Community post.
2 Click the number to open the Device > Monitor > Monitor Alerts page. Refer to Manage alerts - Legacy UI.
3 Click the number to open the Device > Support page. Refer to (Deprecated) Managing tickets - Legacy UI.
4 Not populated automatically. Expired status is displayed the day after the device's warranty expires. For information on how to update this field, refer to Edit device details.
5 Only available for Windows devices.
6 Click the hyperlink to open the Device > Manage > Patch Management page. Refer to Patch Management at the device level.
7 Only displayed for Windows and macOS devices. Click the hyperlink to open the Device > Manage > Software Management page. Refer to Software Management at the device level.
8 Refer to Antivirus detection - Legacy UI.
Click the Refresh icon ![]() to refresh the current view of the device.
to refresh the current view of the device.
NOTE The Refresh icon does not display for offline machines, ESXi devices, network devices, printers, and mobile devices. In some cases they do not display at all (for example, due to incomplete audit).
IMPORTANT The Mobile Device Management (MDM) feature is no longer available. For more information, refer to this Kaseya Community post.
This section lists all notes that have been added to this device, including their log time. To add a note:
- Click Create Note.
- Enter your note.
- Click Add to save it.
- Once it has been saved, you can edit or remove it by clicking on the Edit Note icon
 or the Delete this Note icon
  .
.
TIP You can also add a note to the device in the New UI or through the Agent Browser. For information, refer to Notes (New UI) and Notes (Agent Browser).
This section is on only available for printers to show toner information.
The following fields are displayed: Description, Remaining, Status.
IMPORTANT We recommend that you do not store credentials or other sensitive/confidential information in UDFs as the information contained in these fields is visible in plain text.
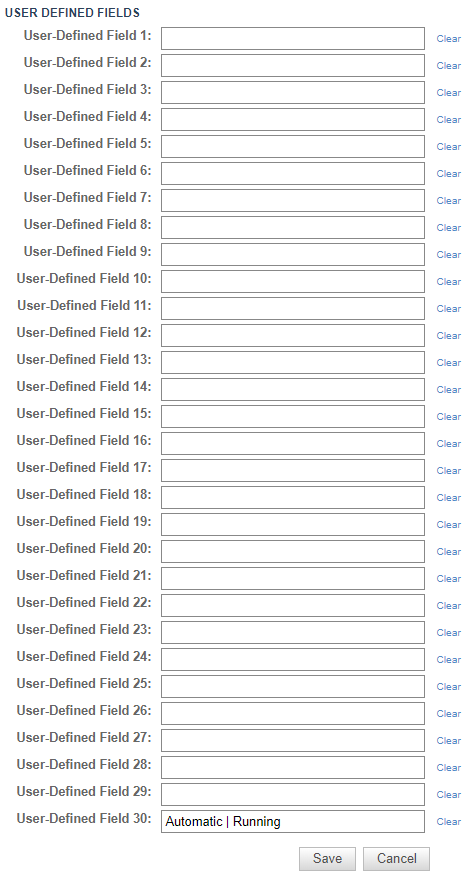
User-Defined Fields 1-30 are only displayed if they have been populated with information.
To manually enter information into the user-defined fields, follow these steps:
NOTE UDFs have a limit of 255 characters.
NOTE UDF labels have a limit of 22 characters.
- Click Clear to remove any of the information.
- Click Save to save your changes or Cancel to discard them.
To learn how to populate the UDFs in the New UI, refer to UDFs.
To find out more about user-defined fields, refer to the following topics:
- User-defined fields - Legacy UI
- User-Defined Fields in Account Settings - Legacy UI (legacy UI)
- User-Defined Fields in Site Settings - Legacy UI (legacy UI)
- User-Defined Fields in Global Settings (New UI)
This section is only available for Hyper-V-enabled devices and ESXi hosts.
The following fields are displayed: Hostname, Guest Name, Operating System, Status.
NOTE Limited information is displayed if the virtual machine doesn't have a Datto RMM Agent installed. For the Hostname and Status columns to be populated, ESXi guests require an RMM Agent to be installed from the same site the ESXi host and Network Node reside in.
This section displays all monitors applied to a device that can show real-time data, whether the monitor is applied at the device level or is part of a Monitoring policy. Real-time monitor output makes it easier to check whether the monitors are working properly.
This section is available for the following device types: server/desktop/laptop, ESXi host, network device, and printer.
| Field | Description |
|---|---|
| Show entries | Select to show 10 / 25 / 50 / 100 entries per page. 25 is selected by default. |
| Search | A dynamic search field that lets you search for monitors. As you type, the search results are narrowed to match your search string. |
| Monitor | Displays the Monitor type and description. You can click the column header to sort by this data. In the case of SNMP monitors, when there is data for multiple instances, the instance name is appended to the description. If there is no data reported for the SNMP monitor, only a single entry for the monitor will appear, and there will be no live data. Click the hyperlink to open the Monitors page (in the case of standalone monitors) or the Monitoring policy that the monitor is part of. For more information, refer to Manage monitors. |
| Priority | For more information, refer to Manage monitors. Click on any of these columns to sort the data. NOTE Any Drive Disk Usage monitor will only show value for a drive that is closest to the threshold set within the monitor. Refer to Disk Usage Monitor (Windows only) in the legacy UI and Disk Usage monitor in the New UI. NOTE ESXi Data Store monitor will only show the datastore that is closest to the threshold set within the monitor. Refer to ESXi Data Store Monitor in the legacy UI and ESXi Data Store monitor in the New UI. NOTE Real-time monitoring metrics are stored for seven days and up to a maximum of 60 metrics. If no data is received in seven days (for example, the device goes offline), the Latest Value and Last Reading results will revert to No Data and Never, respectively. NOTE The Latest Value field is always blank for a Ransomware monitor, which is available in the New UI. |
| Latest Value | |
| Last Reading | |
| Status | |
| Previous / Next | Click a page number or click Previous / Next to see the previous or next page of results. |
This section directs you to the device summary page in the New UI to see the activities that have been carried out on the device. Refer to Device summary.
NOTE All activity logging is now available exclusively in the New UI.


