Dashboards
PERMISSIONS Ensure you have at least View permission for Global > Dashboard to prevent an Access denied error message when you log in to your account. Refer to Permissions.
NAVIGATION Dashboards
NAVIGATION Sites > All Sites > click the name of a site > click the name of a dashboard (left navigation menu)
About dashboards
Dashboards display the information in your database in a graphical format, allowing you to visualize and monitor the health of your estate at a glance. You can access all of your dashboards by using the left navigation menu, either from the Dashboards menu item or the Sites menu item. Dashboards accessed from the Sites menu item will be filtered by the specific site selected.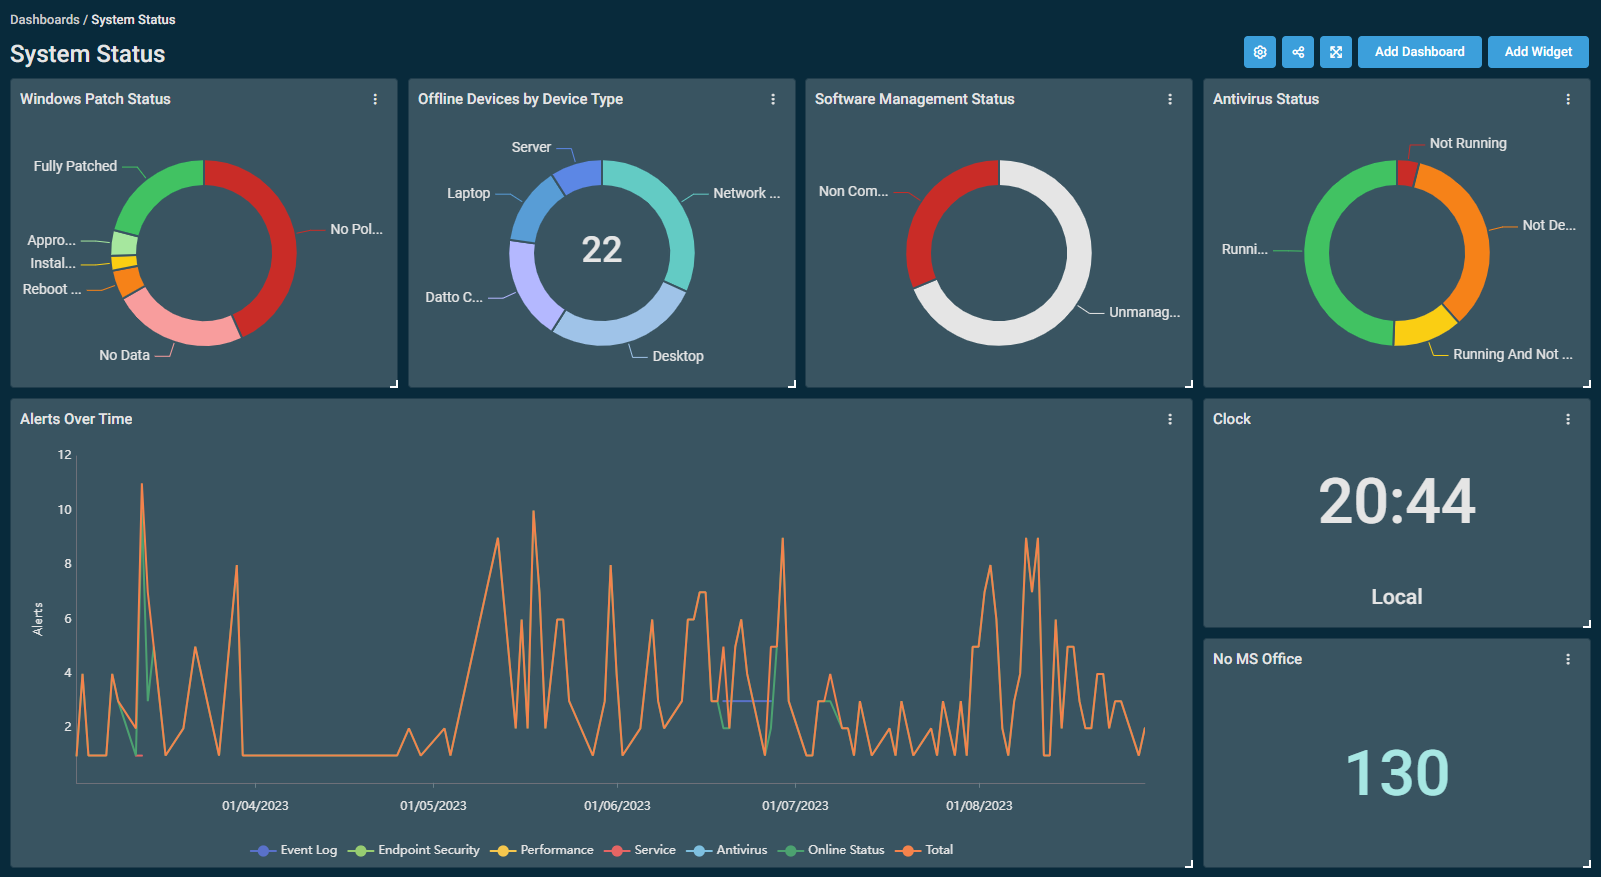
Upon reducing the browser window size while viewing a dashboard, the left navigation menu will automatically collapse. Toolbar or other buttons within the widgets will also wrap for low resolutions.
Dashboards can also be configured to responsively adjust to the screen resolution. For example, if the dashboard is being viewed on a mobile device or in a smaller browser window, the widgets will stack vertically. Refer to Setting screen resolution.
The left navigation menu is automatically hidden when viewing a dashboard in full-screen mode.
Dashboards toolbar
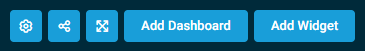
From the dashboards toolbar, you can do the following:
- Manage your dashboards by clicking the Dashboards Settings icon to access the dashboards settings. Refer to Dashboards settings.
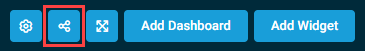
- Share the dashboard you are currently viewing by clicking the Share icon. Refer to Dashboard sharing.
- Access full-screen mode by clicking the Full screen icon or by pressing the M key on your keyboard. This function is only available when the dashboard contains at least one widget.
- Open the Dashboard Library by clicking Add Dashboard, which opens a pane that allows you to choose a blank dashboard or a pre-made option. Click Add next to the type of dashboard you wish to create. The new dashboard will open and be added to the left navigation menu with its default name, which you can change in the dashboards settings. Refer to Dashboards settings.
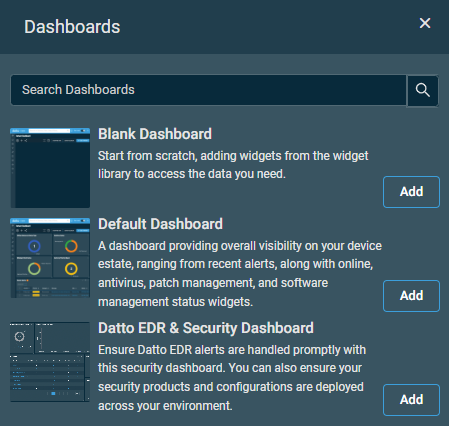
The following dashboard templates are currently available from the Dashboard Library: - Add and configure widgets within the current dashboard by clicking Add Widget. Refer to Widget Library.
IMPORTANT To guarantee you are not logged out of Datto RMM due to inactivity while viewing or presenting a dashboard in full-screen mode, ensure you have closed out of all other browser tabs and do not exit full-screen mode.
NOTE Widgets are not clickable or editable in full-screen mode.
NOTE Pressing the F11 key puts your browser in full-screen mode but does not put the dashboard itself in full-screen mode. To put the dashboard in full-screen mode and allow for dashboard rotation, ensure that you have enabled dashboard cycling. Refer to Dashboard cycling. Then, press either the Full screen icon or the M key.
| Name | Description | Availability | Default Widgets |
|---|---|---|---|
| Blank Dashboard | Start from scratch, adding widgets from the Widget Library to access the data you need. | General | None |
| Default Dashboard | A dashboard providing overall visibility on your device estate, ranging from recent alerts, along with online, antivirus, patch management, and software management status widgets. | General | |
Datto Endpoint Security Dashboard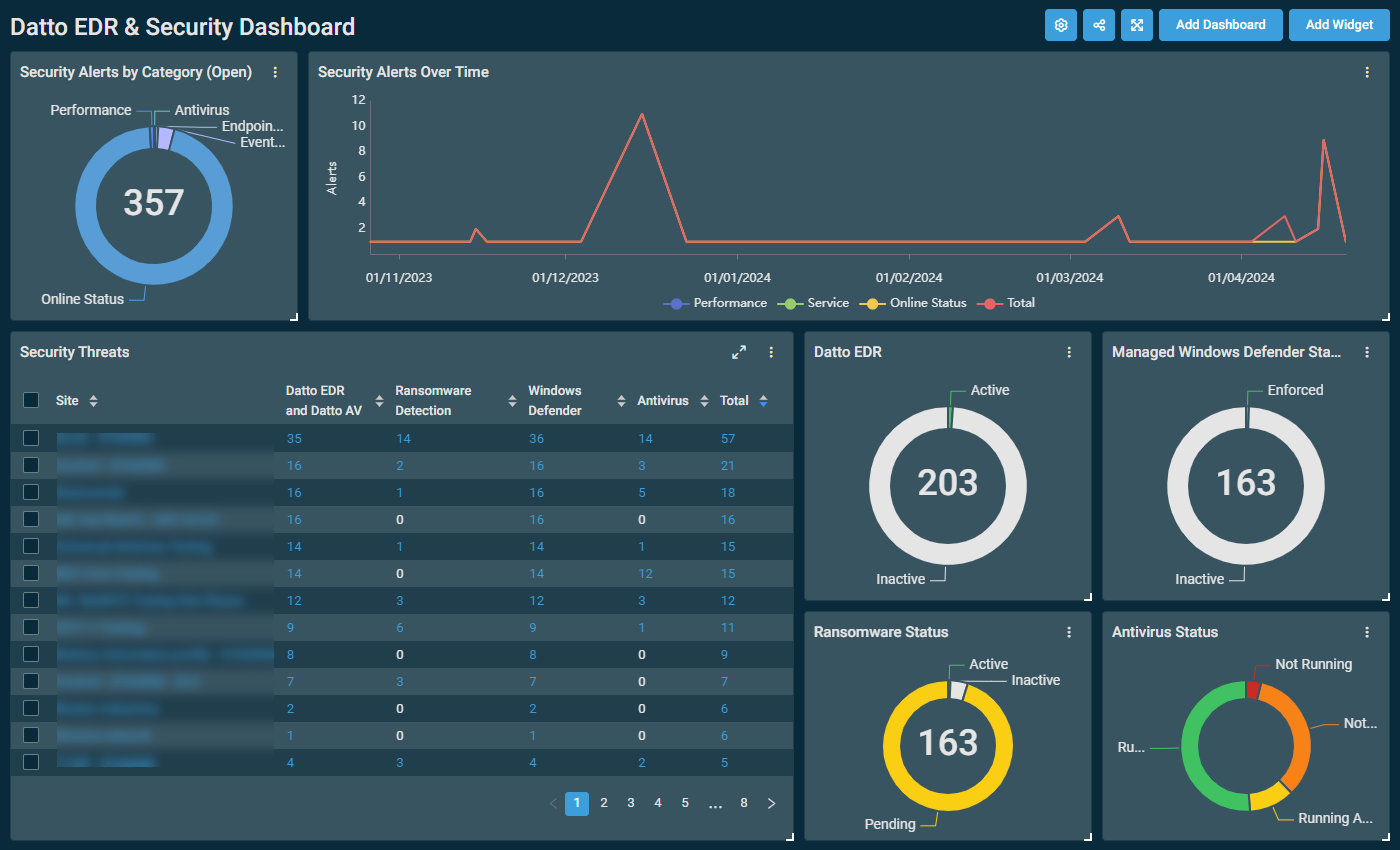 |
Ensure Endpoint Security alerts are handled promptly with this security dashboard. You can also ensure your security products and configurations are deployed across your environment. This dashboard is designed for monitors with resolutions of 1920 x 1080 pixels. However, the widgets, widget sizes, and widget organization can be customized as preferred. | Only in accounts with the Datto Endpoint Security Integration enabled. Refer to Datto Endpoint Security Integration. To learn about the Endpoint Security features in Datto RMM, refer to Endpoint Security overview. |
Dashboard sharing
This section describes the dashboard sharing permissions that apply to the different types of security levels, how to share a dashboard, and the indications that a dashboard has been shared.
Permissions
Administrator security level
- Can share dashboards they have created with any security levels.
NOTE It is not possible to share a dashboard with only other administrator users. By default, all users with the Administrator security level receive all dashboards that are shared with any other security levels.
- Cannot further share dashboards that have been shared with them.
- Can access, view, edit, copy, and delete dashboards that have been shared with them. Refer to Dashboards settings.
Non-administrator security level
- Cannot share dashboards they have created.
- Cannot further share dashboards that have been shared with them.
- Can access, view, and copy dashboards that have been shared with them. Refer to Cloning dashboards.
- Cannot edit or delete dashboards that have been shared with them. However, if they copy the dashboard, they can edit and delete the copy.
Steps for sharing dashboards
Users with the Administrator security level can share a dashboard as follows:
- Navigate to the dashboard you would like to share.
- Click the Share icon in the toolbar.
- In the Security Levels pane, click Select to share the dashboard with a security level. Click Deselect to remove dashboard access for a security level.

Identifying shared dashboards
Once a dashboard is shared, the Share icon is displayed next to the name of the dashboard in the left navigation menu and within Dashboards settings. This is visible to users with the Administrator security level and to the recipients of the dashboard.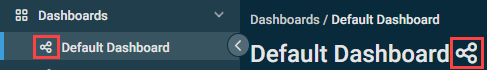
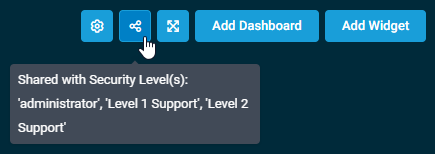
Hovering over the Share icon in the Dashboards toolbar will display the security levels that the dashboard has been shared with.