Reports
PERMISSIONS Refer to Reports > Active Reports in Permissions.
NAVIGATION Analytics > Reports
NAVIGATION Sites > All Sites > click the name of a site > select one or more devices (check boxes) > click the Row Actions icon > Create a Report
NAVIGATION Devices > All > select one or more devices (check boxes) > click the Row Actions icon > Create a Report
NAVIGATION Device summary page > click the More icon > Create a Report. To view the various navigation paths you can use to access the device summary page, refer to Device summary.
NAVIGATION A targeted list of devices > select one or more devices (check boxes) > click the Row Actions icon > Create a Report. To view the navigation paths for the various targeted lists of devices, refer to Targeted lists of devices in Devices.
About reports
Datto RMM features a large number of reports and exports that users with sufficient permissions can generate.
- All reports can be scheduled from the Reports page, device lists, and the device summary page.
- Flexible target selection is available. Any report can be run against a combination of devices, sites, filters, and groups.
- Reports are multilingual. You can set the language of the reports to English, German, French, Spanish, or Italian.
- Every report has its own set of criteria. This allows you to control what data is displayed in the reports. Depending on the report, you can specify criteria, such as date range, columns, filters, and thresholds.
- Reports are delivered in PDF format, while exports are delivered as CSV files that you can use with third-party tools and applications.
- When multiple sites are included in the targets, you can use the aggregate report option to create a single report.
About quick reports
A quick report allows you to quickly configure a report and run it immediately from the device summary page or a list of devices without having to schedule it. For more information, refer to Quick reports.
Design and format
The report scheduler is flexible and allows you to configure various options in both reports and exports. Both reports and exports are delivered via email.
Reports
Every report is delivered in PDF format and follows a specific design guideline on the cover page: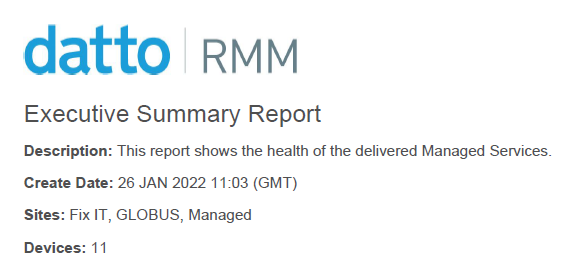
- Report Name
- Description
- Create Date: DD MON YYYY. Time and time zone information is added after the date, for example, 26 JAN 2022 11:03 (GMT).
- Sites
- Filters
- Device Name
- Groups
- Devices: Shows the total number of devices listed in the report.
NOTE A maximum number of 25 sites/filters/device names/groups are listed on the cover page. If more than 25 have been selected of any of these items in the report targets, it will be indicated in parentheses at the end of the respective list, for example, (5 more sites) or (10 more filters).
Exports
Exports are delivered in CSV format so that you can use them according to your business needs (for example, in third-party applications).
NOTE Export CSV files are encoded in UTF-8 with a byte-order mark.
NOTE Microsoft Excel is unable to properly display UTF-8 compliant CSV files when they contain non-English characters.
Time zone
The creator of the report or export configures the schedule according to their user time zone configured on the Setup > My Settings page. The report will run at the respective time in all users' time zones. Refer to User Time Zone.
The following reports and exports are available.
Reports
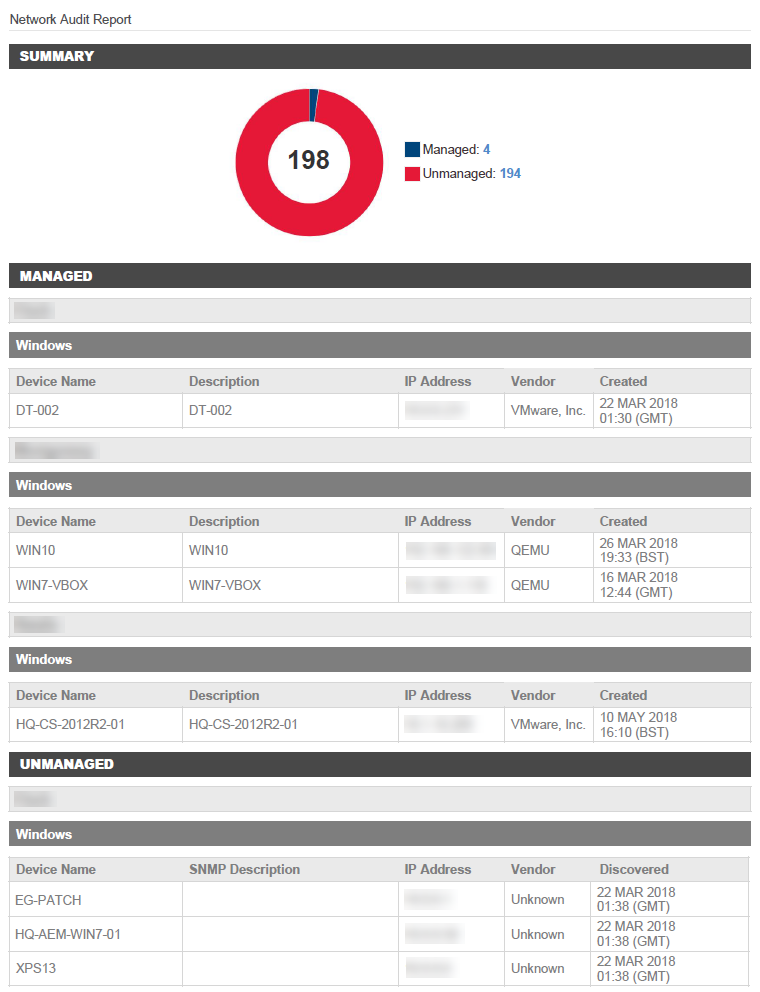
Detailed Computer Audit report
Patch Management Activity report
Patch Management Details report
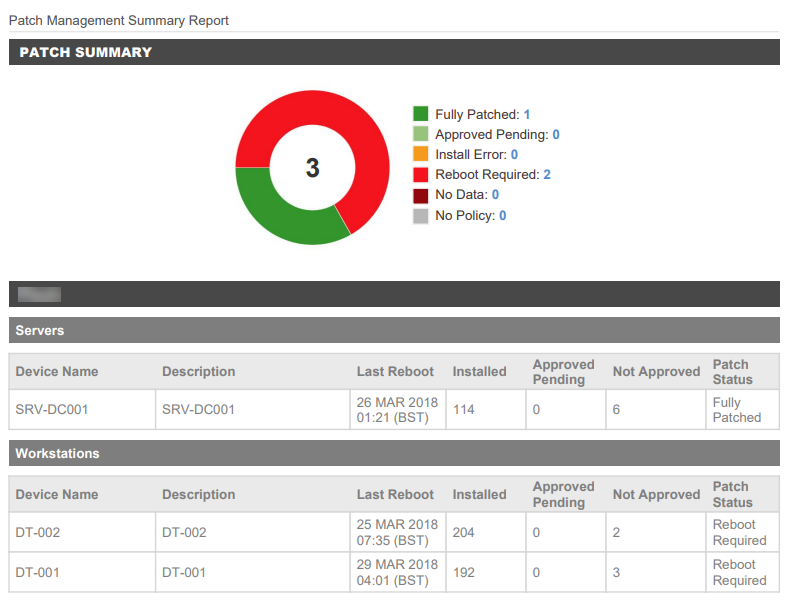
Patch Management Summary report
Exports
Creating a report
To create a report, follow any of the navigation paths described in Security and navigation.
Enter a name for the report. By default, the following name is populated: Scheduled Report for [username]. This field has a limit of 100 characters.
Select one of the following options:
- Aggregate: A single report will be created that will include all targeted devices and sites.
- Individual: An individual report will be created for each targeted site.
Click Add Report/Export to open a pane on the right. To search for a report or export, scroll down in the Reports or Exports tabs or use the Search bar. The search results will be narrowed as you type. Click Add or Remove to add or remove any report or export.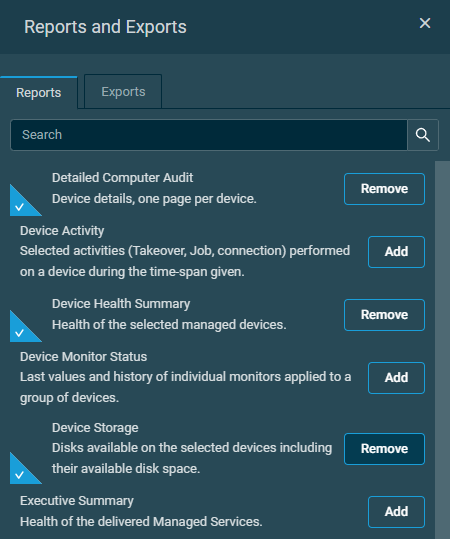
The tab selection will persist the next time the pane is accessed.
You can also remove a report or export on the report page by clicking the delete icon ![]() .
.
Reports
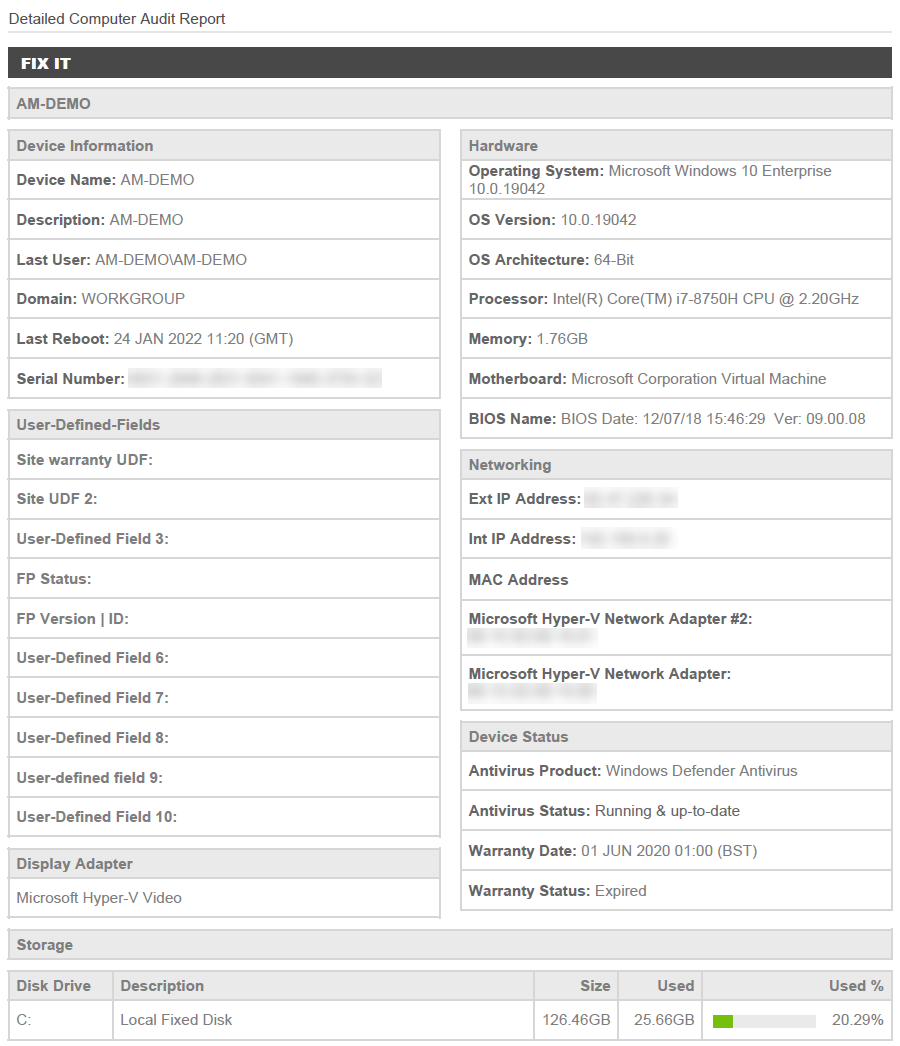
This report shows many device details on one page per device. It sorts by device type within each site. Servers are listed on top. The report includes the following sections, depending on the device type:
- Device Information
- User-Defined Fields
- Display Adapter
- Storage
- Hardware
- Networking
- Device Status
Report options
Select any or all of User-Defined Fields 1-10.
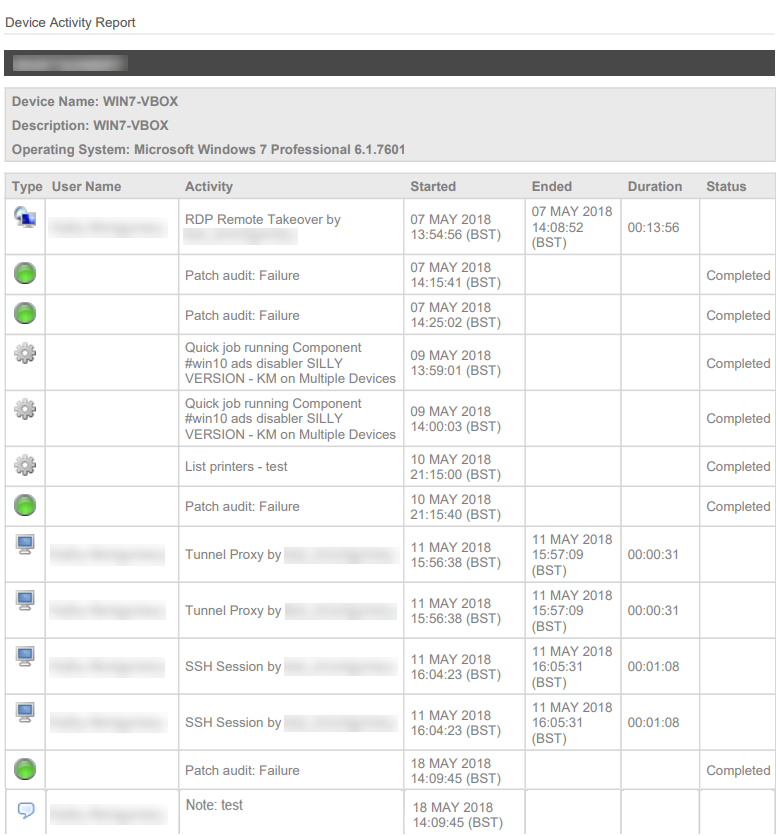
This report shows the selected activities performed on the targeted devices in the selected date range. Devices are grouped by site and activities are sorted by start date (ascending). Notes added to a device in the UI or Agent Browser are shown in the report in the Activity column with the heading Note followed by the contents of the note. The time a note was added to a device is also displayed.
Report options
Select one of the following date ranges:
- Last 7 days (selected by default)
- Last 30 days
- Current month
- Custom: Using the calendar, specify a custom start/end date and time.
Select any or all of the following activities:
- Device Moved Site
- File Transfer
- Job
- (Deprecated) Mobile
IMPORTANT The Mobile Device Management (MDM) feature is no longer available. For more information, refer to this Kaseya Community post.
- Note
- Patch
- Remote Actions: Remote actions including event viewer, screenshot, registry editor, network control, PowerShell, shut down, and LAN deployment.
- Remote Shell
- Remote Takeover: RDP, VNC, Splashtop, and Web Remote.
- Security
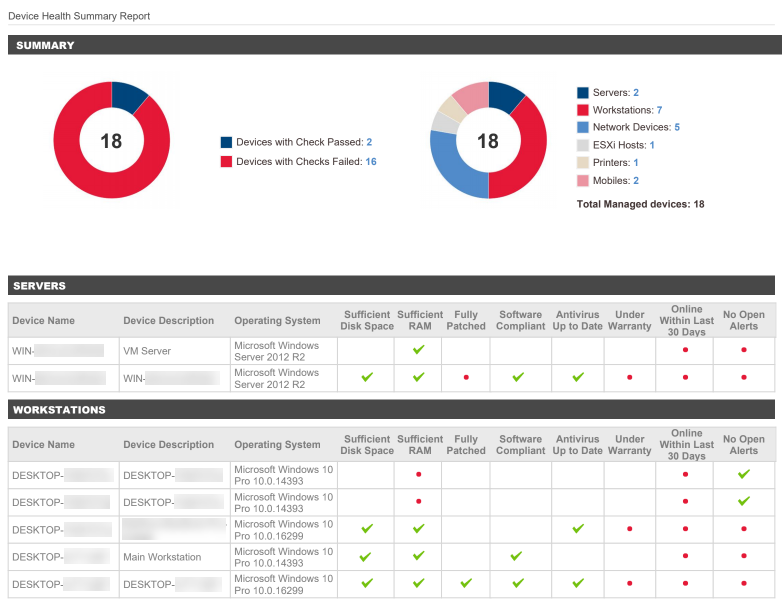
This report shows the health of the targeted managed devices. It displays the total number of devices that passed or failed all health checks. Problem areas include whether the device is fully patched, is software compliant, has up-to-date antivirus, if it's been online within the last 30 days, or if it has open alerts. The health checks vary depending on the device type:
- Server
- Workstation
- Network Device
- ESXi Host
- Printer
- (Deprecated) Mobile
IMPORTANT The Mobile Device Management (MDM) feature is no longer available. For more information, refer to this Kaseya Community post.
The following icons are displayed in the report:
![]() : The device has passed the health check.
: The device has passed the health check.
●: The device has failed the health check.
Blank field: A blank field is displayed if no data is available.
NOTE Patch Management data is only available for Windows devices. The Fully Patched field is left blank for all non-Windows devices or if a Windows device is not targeted by a patch policy. If a device has approved patches, the Fully Patched field displays a red dot ● as the device is not fully patched.
NOTE Software compliance data is only available for Windows and macOS devices. The Software Compliant field is left blank if the device's Software Status is Unmanaged. Refer to Software status
Report options
Configure the following options:
- Minimum amount of free space required on the system drive (% or GB). Default value: 15%.
- Minimum amount of RAM required on a device (GB). Default value: 3.8 GB.
A device will pass the health checks if they meet the requirements specified above.
NOTE If a system drive cannot be identified on a device (including Windows devices that have not yet been audited and non-Windows devices), the free space calculation is based on all fixed drives, and device health is reported based on any of the drives failing the threshold.
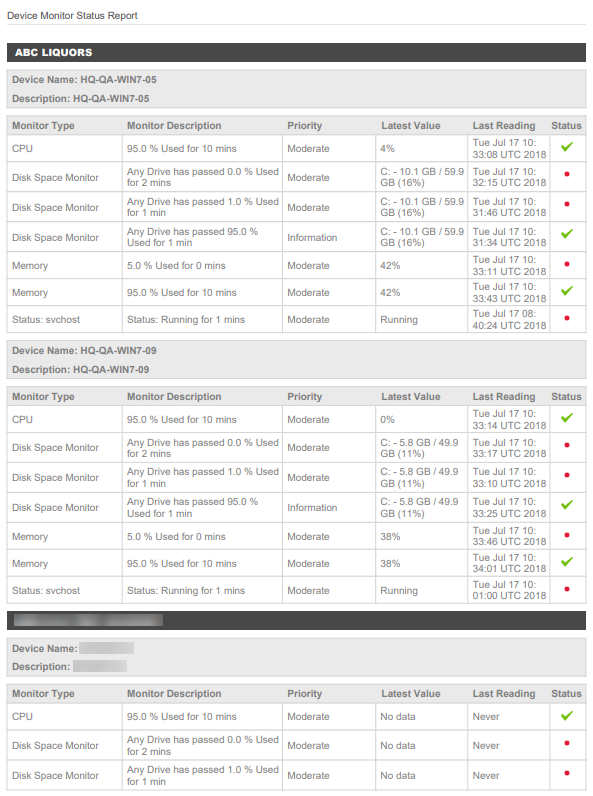
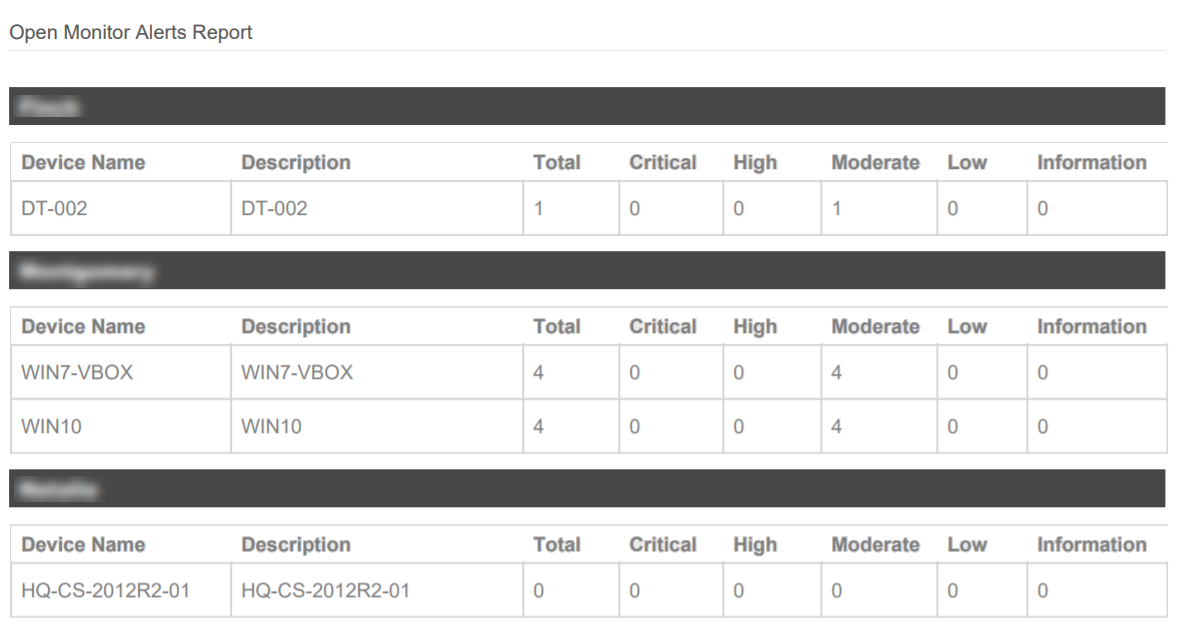
This report shows the last values and history of individual monitors applied to the targeted devices. The devices and monitors are sorted in alphabetical order within each site.
Report options
Select any or all of the following monitor statuses:
- Alert
- Not responding
- OK
Select any or all of the following monitor types:
- Antivirus Status
- Component
- CPU
- Disk Usage
- Endpoint Security
- File/Folder Size
- Memory
- Ping
- Process
- Ransomware
- Service
- SNMP
- SNMP Throughput
- Software
- Windows Performance
- WMI
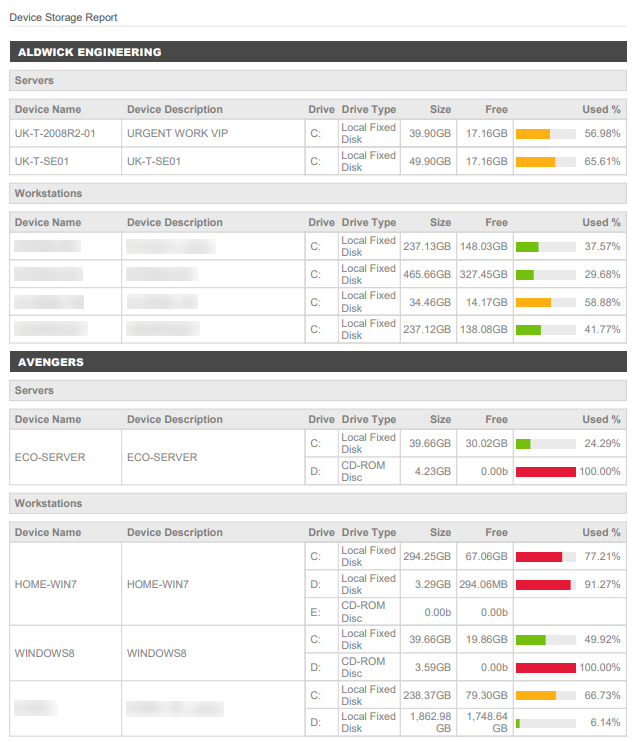
This report lists the selected disks available on the targeted devices, including their available disk space. It groups by device type within each site. Servers are listed on top. Within each device type group, it sorts by Device Name in alphabetical order, and then by Drive in alphabetical order.
Report options
Select any or all of the following drive types:
- Indeterminate
- Local Disk (selected by default)
- Network Drive
- Optical Media
- Ram Disk
- Removable Drive
- Unknown
NOTE The Device Storage report does not report on ESXi storage devices.
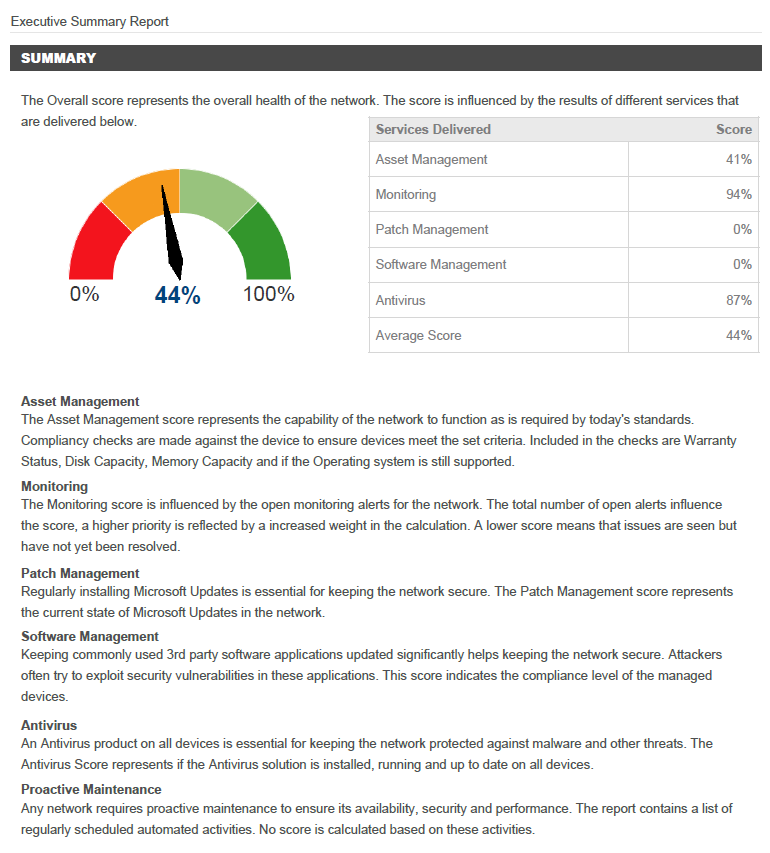
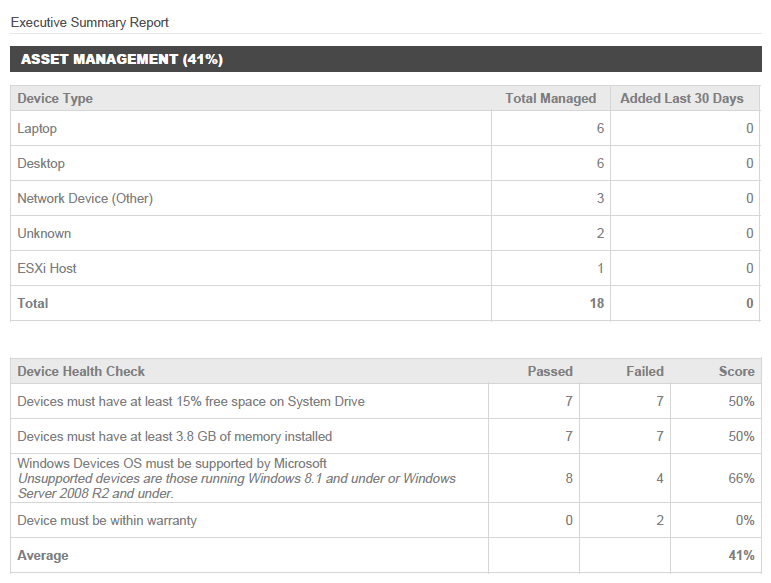
This report shows the health of the delivered managed services.
NOTE Patch Management data is only available for Windows devices.
NOTE Software compliance data is only available for Windows and macOS devices.
Report options
Configure the following options:
- Minimum amount of free space required on the system drive (% or GB). Default value: 15%.
- Minimum amount of RAM required on a device (GB). Default value: 3.8 GB.
A device will pass the health checks if they meet the requirements specified above.
NOTE If a system drive cannot be identified on a device (including Windows devices that have not yet been audited and non-Windows devices), the free space calculation is based on all fixed drives, and device health is reported based on any of the drives failing the threshold.
Select any or all of the following sections to be included in the report. (All are selected by default.)
- Antivirus: Displays Server Antivirus Status and Workstation Antivirus Status.
- Asset Management: Displays a list of all Device Types. The Device Health Check table includes four checks. The first two checks (free space calculation and installed memory check) exclude Datto Continuity devices, Datto Networking devices, mobile devices, ESXi devices, and network devices. The third check includes devices whose operating system is supported by Microsoft. The fourth check (warranty status) only includes Windows devices that report a warranty date. To exclude the warranty status check from the report, clear the Device Health - Warranty check box from within the Asset Management section.
NOTE For information about which operating systems are no longer supported by Microsoft, refer to Microsoft Lifecycle Policy.
- Monitoring: Displays the following categories: Total Alerts by Priority, Total Alerts by Device Type, Top 5 Servers by Alerts, and Top 5 Other Devices by Alerts.
- Patch Management: Displays Server Patch Status and Workstation Patch Status.
-
Proactive Maintenance: Displays a list of all jobs (both active and completed) that have been scheduled to run on the targeted devices.
NOTE Selecting Proactive Maintenance will add significantly extend report runtime due to the time it takes to query all active and completed scheduled jobs for the targeted devices. For this reason it is recommended to leave this unchecked unless needed.
- Software Management: Displays Server Software Status and Workstation Software Status.
- Summary: Explains the various elements of the report, how they are measured, and their impact on the final score.
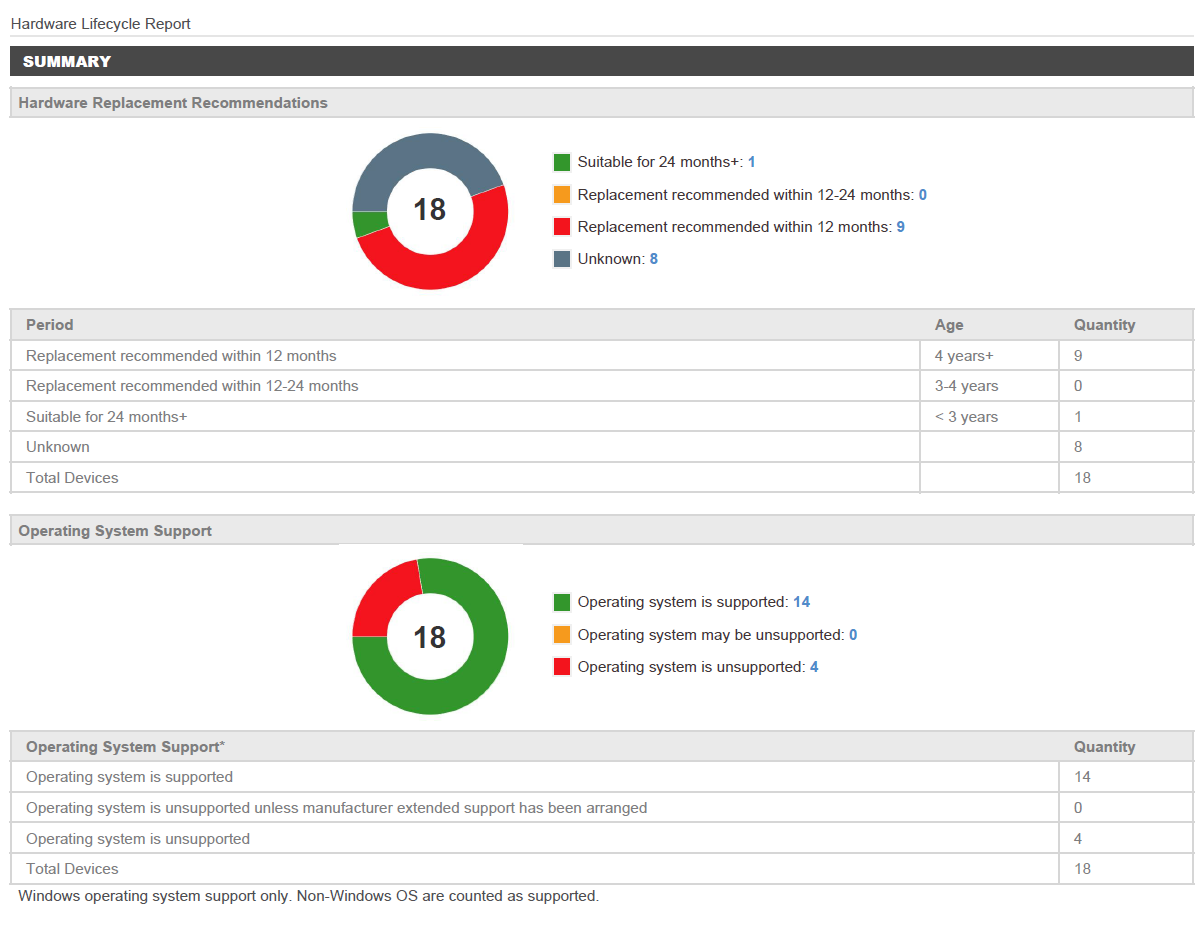
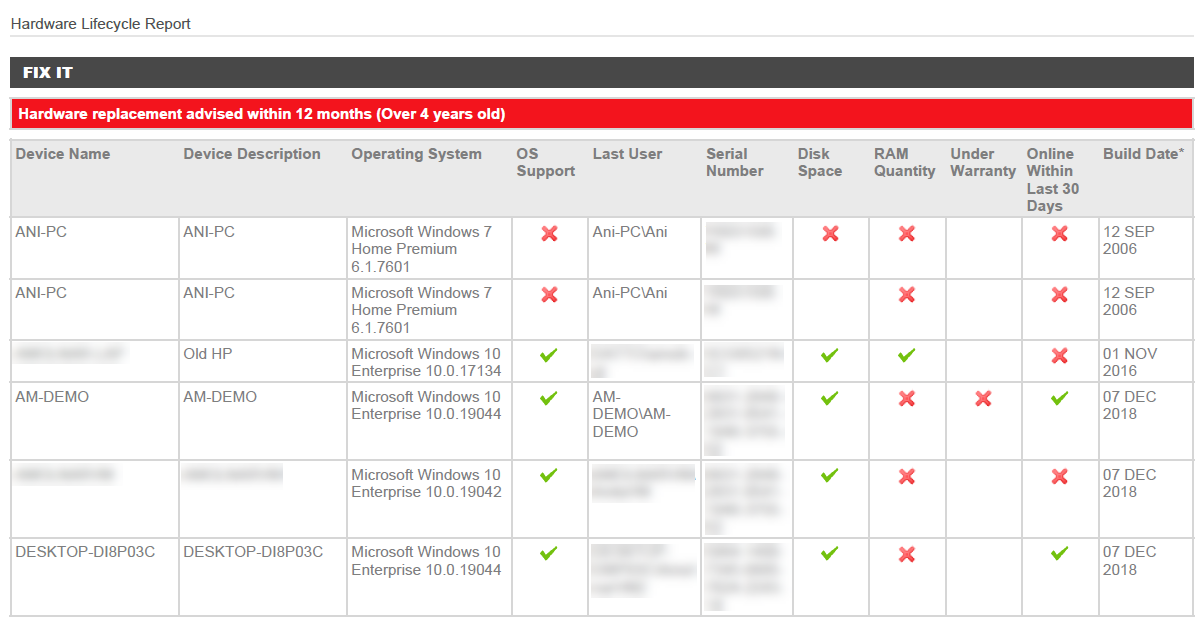
This report can be used to give a clear rundown of inventory nearing the end of its productive lifecycle. The targeted devices are grouped by site and sorted by hardware age (Build Date) first and device name second. Sites are listed in alphabetical order.
NOTE Build Date is based on the BIOS release date. While this is the best metric available, the data should not be treated as definitive since it is not always available.
The following icons are displayed in the report:![]() : The device has passed the health check.
: The device has passed the health check.![]() : The device has failed the health check.
: The device has failed the health check.
Blank field: A blank field is displayed if no data is available.
In addition, the following icons are displayed in the OS Support column:![]() : The device's operating system is supported.
: The device's operating system is supported.![]() : The device's operating system may not be supported.
: The device's operating system may not be supported.![]() : The device's operating system is not supported.
: The device's operating system is not supported.
NOTE For information about which operating systems are no longer supported by Microsoft, refer to Microsoft Lifecycle Policy.
Report options
Configure the following options:
- Minimum amount of free space required on the system drive (% or GB). Default value: 15%.
- Minimum amount of RAM required on a device (GB). Default value: 3.8 GB.
A device will pass the health checks if they meet the requirements specified above.
NOTE If a system drive cannot be identified on a device (including Windows devices that have not yet been audited and non-Windows devices), the free space calculation is based on all fixed drives, and device health is reported based on any of the drives failing the threshold.
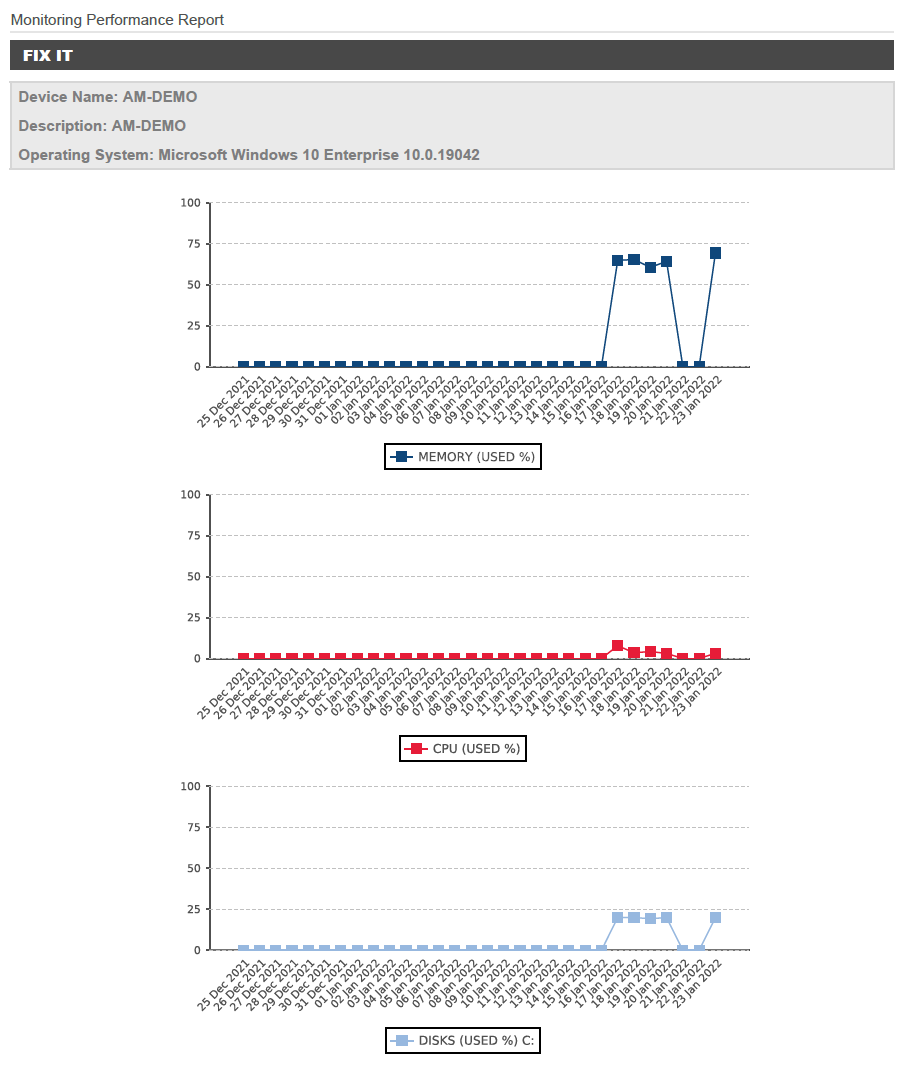
This report shows the CPU, disk, and memory graphs for the targeted devices for the past 30 days.
NOTE These graphs are only available for devices with an Agent installed. Therefore, the number of Targeted Devices on the cover page may differ from the actual number of devices listed in the report.
Report options
Select any or all of the following options:
- CPU
- Disk
- Memory
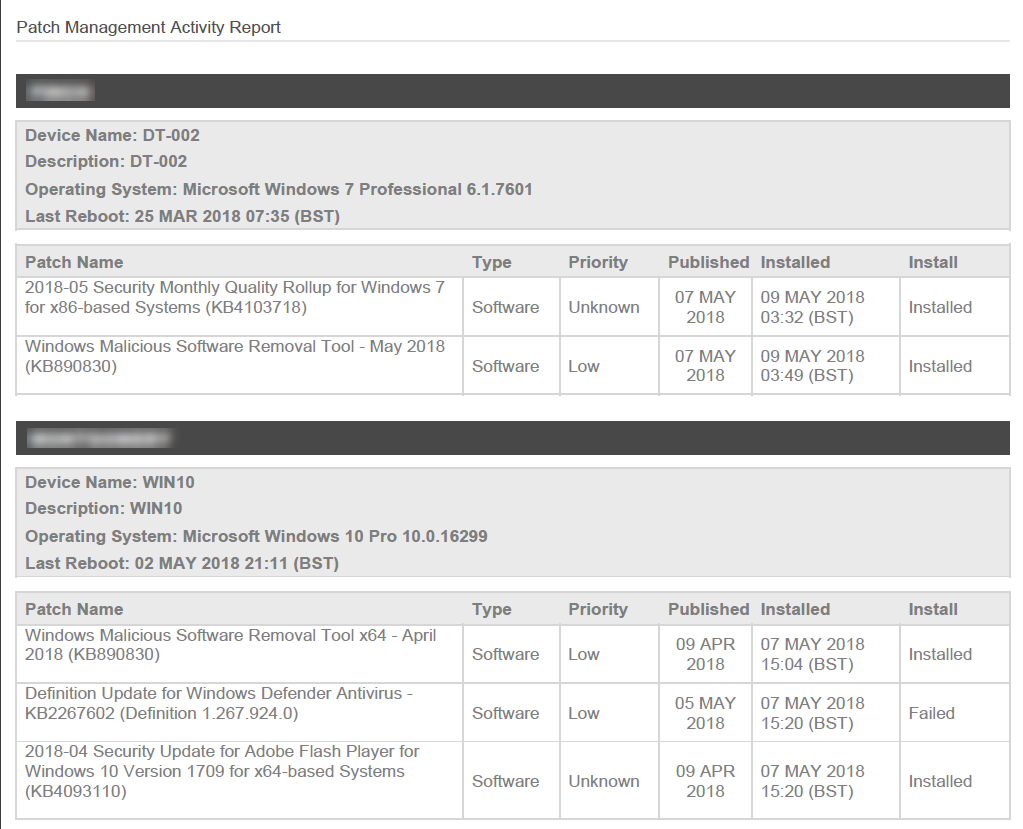
This report shows patch activity for the targeted devices in the selected date range. Devices are grouped by site and patches are sorted by installed date (ascending).
NOTE Patch Management data is only available for Windows devices.
Report options
Select one of the following date ranges:
- Last 7 days (selected by default)
- Last 30 days
- Current month
- Custom: Using the calendar, specify a custom start/end date and time.
Select either or both of the following install statuses:
- Failed
- Succeeded
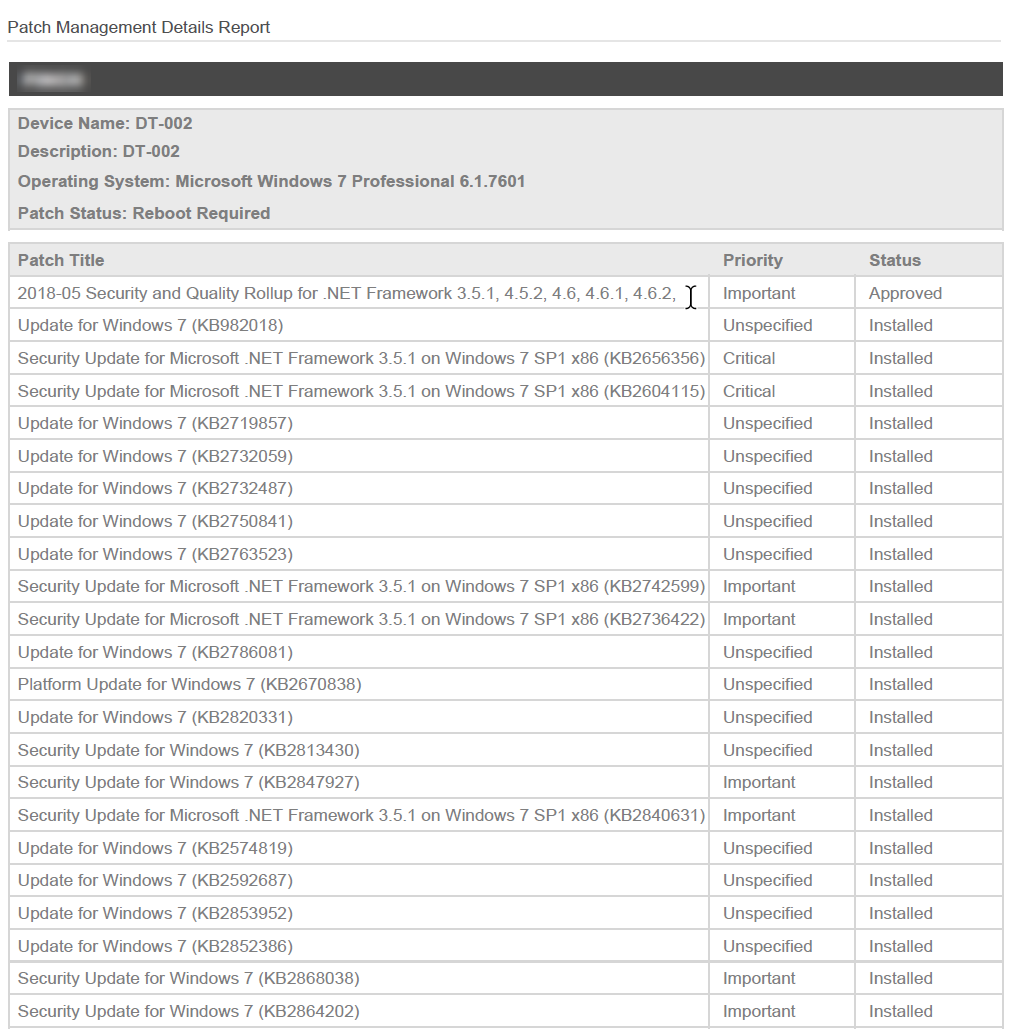
This report gives a high-level overview of the installed, pending, and not approved patches of the targeted devices. Patches are sorted by status and grouped by device type within each site. Servers are listed on top.
NOTE Patch Management data is only available for Windows devices.
Report options
Select one of the following options:
- Show all patches
- Show only selected patches (selected by default). Enter the name of a patch or any text to filter for patches. Click the plus sign to add a patch filter and click the minus sign to delete a patch filter.
Select any or all of the following patch statuses:
- Approved
- Not approved
- Installed
Exports
This export shows a line-by-line list of every activity performed by the selected Administrators in the selected date range.
IMPORTANT This export is only available to Administrators.
NOTE The selected targets will not impact the results of this export but you must define a target to be able to save the report.
Export options
From the drop-down list, select any or all of the Administrators.
Select one of the following date ranges:
- Last 7 days (selected by default)
- Last 30 days
- Current month
- Custom: Using the calendar, specify a custom start/end date and time.
Select the columns you wish to include in the export.
This export shows a line-by-line list of the selected activities performed on the targeted devices in the selected date range.
Export options
Select one of the following date ranges:
- Last 7 days (selected by default)
- Last 30 days
- Current month
- Custom: Using the calendar, specify a custom start/end date and time.
Select any or all of the following activities. (All are selected by default.)
- Device Moved Site
- File Transfer
- Job
- (Deprecated) Mobile
IMPORTANT The Mobile Device Management (MDM) feature is no longer available. For more information, refer to this Kaseya Community post.
- Patch
- Remote Actions: Remote actions including event viewer, screenshot, registry editor, network control, PowerShell, shut down, and LAN deployment.
- Remote Shell
- Remote Takeover: RDP, VNC, Splashtop, and Web Remote.
- Security
Select the columns you wish to include in the export.
This export shows the selected types of changes in the device change log of the targeted devices in the selected date range.
Export options
Select one of the following date ranges:
- Last 7 days (selected by default)
- Last 30 days
- Current month
- Custom: Using the calendar, specify a custom start/end date and time.
Select any or all of the following change types:
- Hardware
- Software
- System
Enter any text in the Changed audit field contains field to filter for information in the change log.
Select the columns you wish to include in the export.
This export shows all available device information of the targeted devices.
Export options
Select the columns you wish to include in the export.
This export shows devices with pending patches at the device level.
NOTE Patch Management data is only available for Windows devices.
Export options
Select the columns you wish to include in the export.
This export lists all available disks on the targeted devices, including their available disk space.
Export options
Select the columns you wish to include in the export.
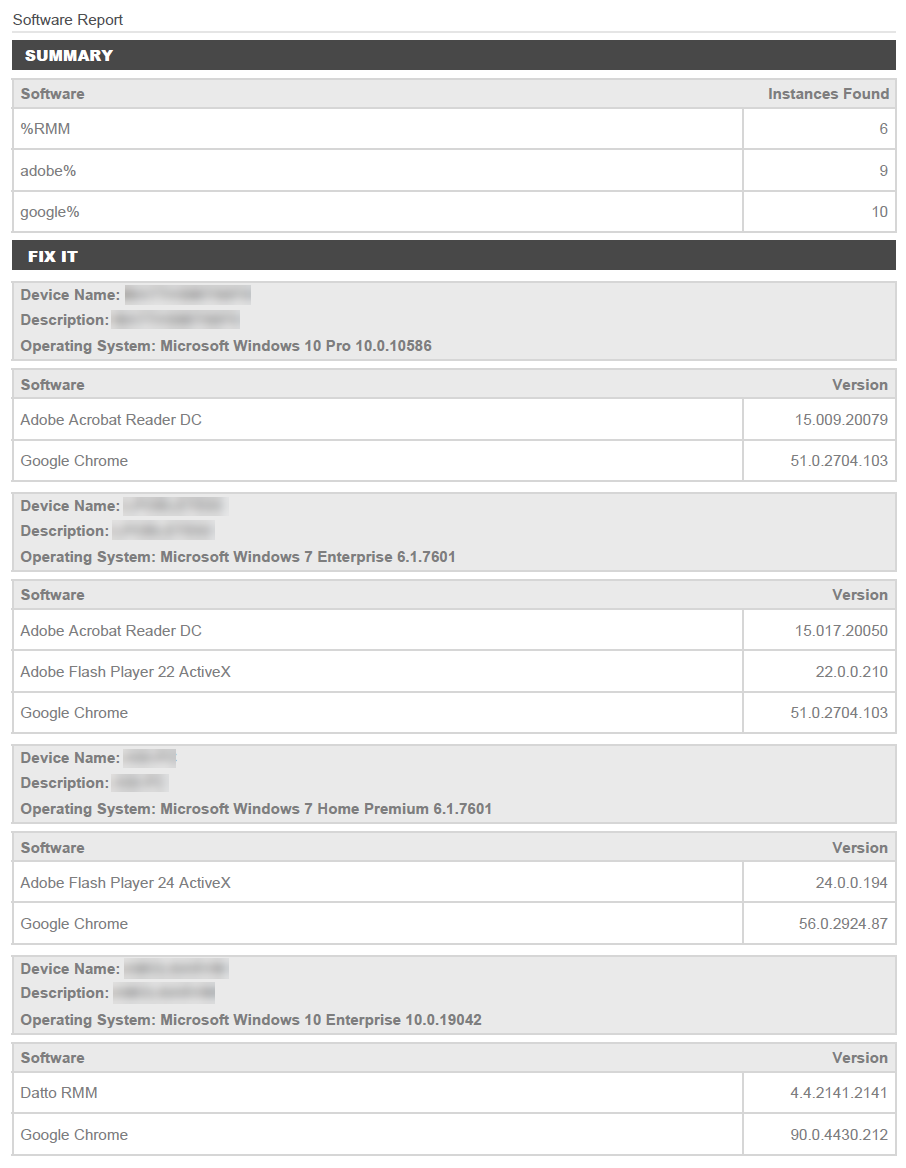
This export shows installed software and versions per device matching your criteria.
Export options
Select one of the following options:
- Show all software
- Show only selected software (selected by default). Enter the name of an application and use the % wildcard character if necessary (for example, adobe%, %RMM). Click the plus sign to add a software filter and click the minus sign to delete a software filter.

Select the columns you wish to include in the export.
This export shows the information required by Microsoft for licensing purposes. It includes Microsoft operating systems, applications, and device details.
Export options
Select the columns you wish to include in the export.
This export shows all alerts matching your criteria for the targeted devices in the selected date range.
Export options
Select one of the following date ranges:
- Last 7 days (selected by default)
- Last 30 days
- Current month
- Custom: Using the calendar, specify a custom start/end date and time.
Select one of the following alert statuses:
- All (selected by default)
- Open Alerts
- Resolved Alerts
Select one of the following monitor types or click All to include all monitor types:
- Antivirus
- Component
- Datto Networking Networks
- Endpoint Security
- Event Log
- File System
- Management
- Online Status
- Patch
- Performance
- Process
- Ransomware
- Service
- SNMP
- Software
- WMI
Select the columns you wish to include in the export.
This export shows a list of all patches of the selected patch statuses for the targeted devices.
NOTE Patch Management data is only available for Windows devices.
Export options
Select any or all of the following patch statuses:
- Approved
- Not approved
- Installed
Select the columns you wish to include in the export.
This export shows the total number of devices per site, grouped by device type.
Export options
Select the columns you wish to include in the export.
NOTE When a report is created from a device summary page or a list of devices, the device or the selected devices will automatically be added as targets.
NOTE When the report is run, the target is calculated based on the security level that the report creator was using at the time of scheduling the report. The report will only contain data that their active security level has access to.
- Click Add Target to open a pane on the right.
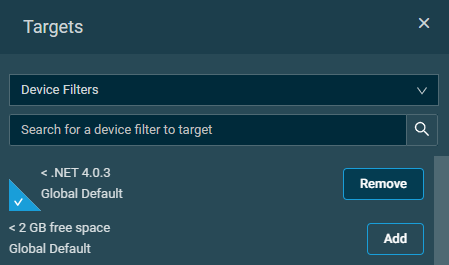
- From the drop-down list, select one of the following target types: Device Filters, Device Groups, Site Groups, Sites, or Devices. You can use the Search bar under any of the drop-down lists, or you can simply scroll down in the lists. If you use the Search bar, the search results will be narrowed as you type.
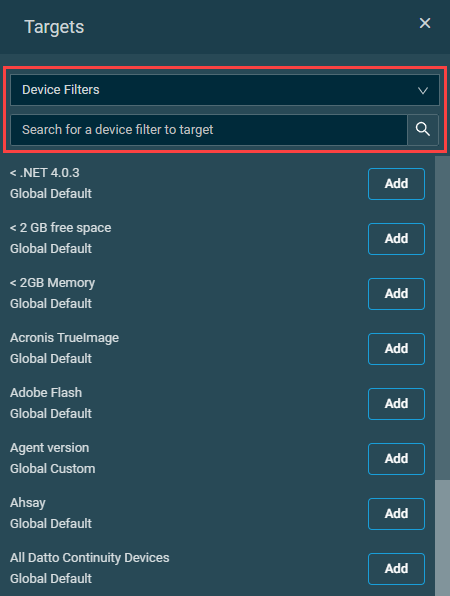
NOTE The Device Filters option contains all Default Device Filters, Custom Device Filters, and Site Device Filters.
NOTE The Device Groups option contains all Device Groups and Site Device Groups.
You can also remove a target on the report page by clicking the delete icon ![]() .
.
- If you have chosen a Default Device Filter, you can edit the sites by clicking the pencil icon on the report page.

Within the Filter by Site(s) pane, toggle the All Sites button off to only select certain sites instead of all sites. You may also search for sites using the Search bar. These changes will be reflected on the report page. If specific sites are selected, hover over the number of sites to see which sites have been selected for this device filter.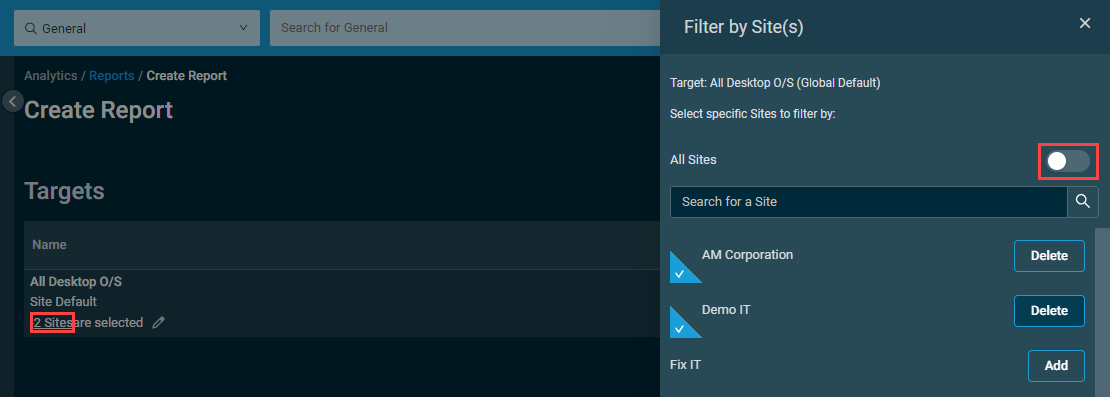
NOTE Exports run without any targeted devices will produce an email with a blank CSV file.
Select an option from the Recurrence drop-down menu to schedule the report. The calendar view provides a visual indicator of when the report will run according to the selected schedule.
The creator of the report or export configures the schedule according to their user time zone configured on the Setup > My Settings page. The report will run at the respective time in all users' time zones. Refer to User Time Zone.
The following options are available:
| Recurrence | Description |
|---|---|
| Immediately | The report will run immediately after creation. |
| At Selected Date and Time | The report will run once on the date and at the time specified in the Start date and execution time section. |
| Weekly | The report will run every week starting from the date and time specified in the Start date and execution time section. In the This Report will run on these days section, select the days on which the report should run. Clicking a second time will clear the selected day. |
| Monthly | The report will run in the selected months starting from the date and time specified in the Start date and execution time section. In the This Report will run in these months section, select the months in which the report should run. Clicking a second time will clear the selected month. In the On these days section, enter the days of the month (1-31) on which the report should run, separating each day by a comma (for example: 1, 2, 3-7), and click Add. Once added, the days will be listed below this field and can be removed by clicking the X next to the day you wish to remove. |
| Monthly Day of Week | The report will run in the selected months on the specified occurrence of the selected days of the week starting from the date and time specified in the Start date and execution time section. Clicking a second time will clear the selected option. |
Reports and exports are delivered via email. Configure the following email options:
| Field | Description |
|---|---|
| Subject | This field is automatically filled in based on your report configuration; however, you can modify it. By default, the following subject line is populated: • Aggregate reports: Scheduled Report: Aggregate Report for [username] • Individual reports: Scheduled Report: Individual Report for [username] |
| Body | This field is automatically filled in based on your report configuration; however, you can modify it. By default, the email body contains the names of the included reports and exports and the username of the user who created the report. |
| Recipients | Configure any of the following options: • Send to default global recipients: Select the check box to send the report to all Email Recipients configured in the Email Recipients section in Global Settings, and make sure those recipients have the Reports option selected. • Send to default site recipients: Select the check box to send the report to all recipients listed in Email Recipients configured at the site level for targeted sites, and make sure those recipients have the Reports option selected. • Add additional recipients: The name and email address of the report creator is automatically added. To add another recipient, click the plus sign. To remove a recipient, click the minus sign. Make sure there is no empty row in this section before saving the report. NOTE The email field accepts the following characters: |
TIP If you wish to customize the email subject line and body, we recommend that you do it as the last step before saving the report. Making changes to the type and number of reports or exports will automatically override these fields.
Set the language of the report to one of the following languages:
- English
- German
- French
- Spanish
- Italian
The report is enabled by default. To disable it, click Disabled.
NOTE Disabling the report will not delete it.
Once you have configured the report details, click Create Report. A dialog box will confirm that the report has been created successfully, and the report will run according to the selected schedule.
If you do not wish to save the report, click Cancel.
Report completion and delivery
Reports are sent from the email address reports@rmm.datto.com. This can be overridden by an alias sender name configured in the Email Settings section in Global Settings.
IMPORTANT Reports have a limit of 50 email recipients. If you have more than 50 email recipients that need to receive report emails, consider using a distribution list email or similar to avoid going over this limit.
Reports are attached to the email in PDF/CSV format. However, if the email including report attachments exceeds 40 MB, or the number of attachments exceeds 480 items, the email will contain a Please download the report(s) from here link. Click the link to download a ZIP file of the report or reports. The download link expires after seven days.
NOTE It is recommended that a third party tool such as 7Zip, available in our ComStore, is used to extract report ZIP files.
Viewing and managing reports
Navigate to the Reports page by following the navigation path described in Security and navigation. The page lists all active and completed reports.
Reports with targets are visible only to the following users:
- Report creator
- Users with at least View permission for Reports > Active Reports and visibility of all targets in the report. Refer to Permissions and Device visibility in Security levels.
- Users with the Administrator security level
Reports without any target are visible only to users with the Administrator security level. For example, if a filter that was used as the only report target gets deleted after creating the report, only users with the Administrator security level will be able to see, edit, and delete the report.
Reports that are currently running or are scheduled to run in the future are listed as Active Reports. Reports that have already run and are not scheduled to run in the future are listed as Completed Reports.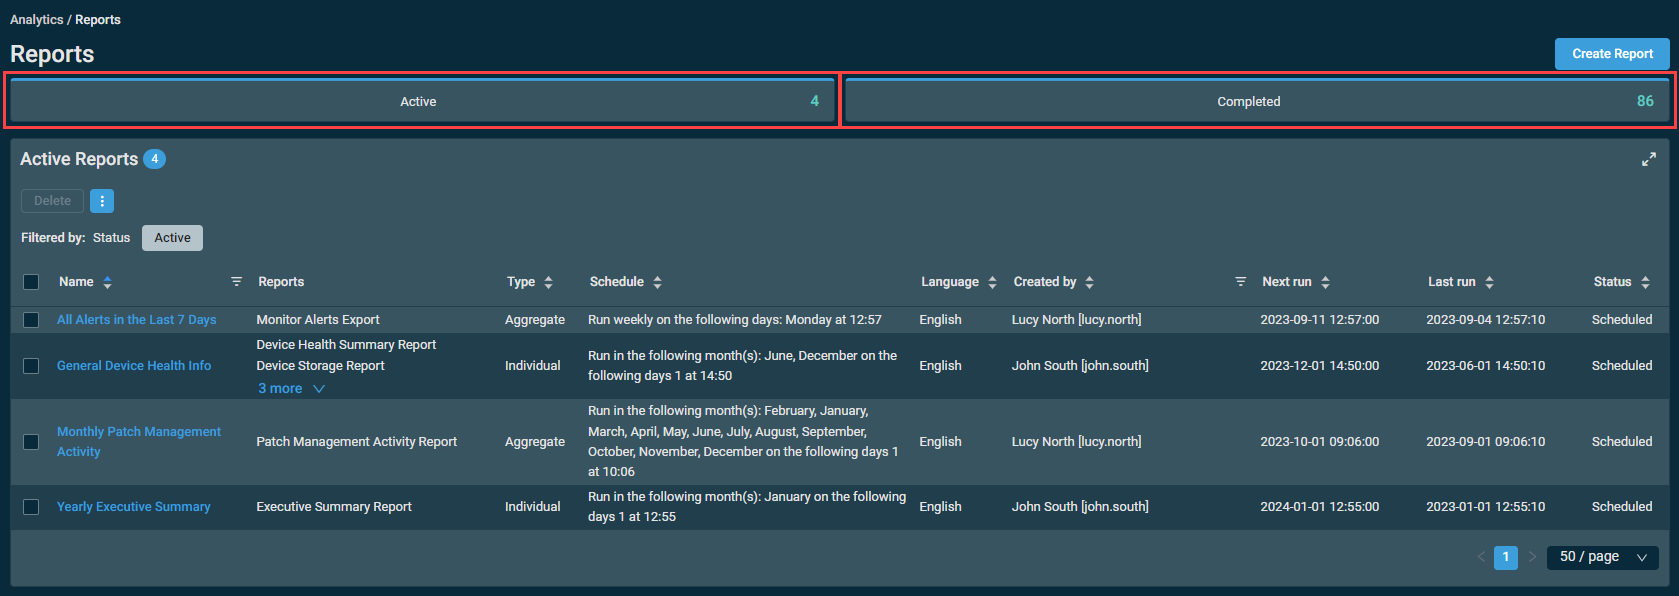
The table displays the following information:
| Field | Sortable? | Description |
|---|---|---|
| Name |
|
The name of the report. To narrow the list, click the filter icon NOTE Quick reports are named as Quick Report for [username]. |
| Reports |
|
Displays the list of reports and exports included in the report. For longer lists, click the more link to expand the list. Click Show Less to collapse the list. Refer to Reports and Exports. |
| Type |
|
Displays the type of the report. Refer to Type. NOTE Quick reports are aggregate reports. |
| Schedule |
|
Displays the schedule of the report. Refer to Schedule. |
| Language |
|
Displays the language of the report. |
| Created By |
|
Displays the user who created the report. To search for a particular user, click the filter icon |
| Next Run |
|
Displays when the report will run next. This field is only displayed for Active Reports. For reports scheduled to run immediately, this field is blank. |
| Last Run |
|
Displays when the report last ran. For reports that have not yet run (or have not yet finished running), this field is blank. |
| Status |
|
Displays whether the report is running or is scheduled to run. This field is only displayed for Active Reports. |
You can filter any columns with the filter icon ![]() . The Filtered by bar displays all applied column filters. If a filter search term includes wildcard characters (for example, underscores and percent signs), they serve as normal characters if they are preceded by a backslash. For details, refer to Wildcard characters. Click the X next to any filter to remove that filter. Click Reset Filters to return to the default view (Status: Active). The filter selection will not persist the next time the page is accessed.
. The Filtered by bar displays all applied column filters. If a filter search term includes wildcard characters (for example, underscores and percent signs), they serve as normal characters if they are preceded by a backslash. For details, refer to Wildcard characters. Click the X next to any filter to remove that filter. Click Reset Filters to return to the default view (Status: Active). The filter selection will not persist the next time the page is accessed.
The table density is set to condensed theme by default. To change it to relaxed theme, click the density toggle icon. ![]() The selection will persist across all pages.
The selection will persist across all pages.
The number of results displayed can be specified by selecting the desired number from the pagination control. This selection will persist the next time the page is accessed.
Action buttons
The action buttons are unavailable if no row is selected or if the action is not applicable to the selected rows. The check boxes allow you to select one or more rows. Select all rows shown on the page by selecting the check box in the table header. To access all action buttons, click the Row Actions icon. The table below lists all available action buttons.
| Action Button | Description |
|---|---|
| Delete | Deletes the selected reports upon confirmation. |
| Uncheck All | Clears all selected rows. The number of selected rows is indicated next to the Row Actions icon. |
Navigate to the Reports page by following the navigation path described in Security and navigation. In the Active Reports or Completed Reports table, click the name of a report to open it.
You can edit a report in the following ways:
- To update the report details, refer to Creating a report.
- To enable or disable a report, refer to Enabling or disabling the report.
- To delete a report, refer to Delete.
