Account Dashboard - Legacy UI
SECURITY Refer to ACCOUNT > Dashboard in Security Level Details - Permissions
NAVIGATION Legacy UI > Account > Dashboard tab
Datto RMM allows you to proactively monitor and manage your endpoints at the Device, Site, and Account level.
At the Device level, the device summary page displays device information and status, notes, activity, and performance information about a single device. For more information, refer to Device summary - Legacy UI.
At the Site level, the site summary page lets you information about all of the devices that have been added to the same site. For more information, refer to Site summary - Legacy UI.
At the Account level, the Account Dashboard provides a summary of the devices, components, notifications, active jobs, and open alerts of all your endpoints across all your sites.
Account Dashboard
To access the Account Dashboard tab, click the Account tab. From there, you can click the Kiosk Mode icon  to open it in a separate window.
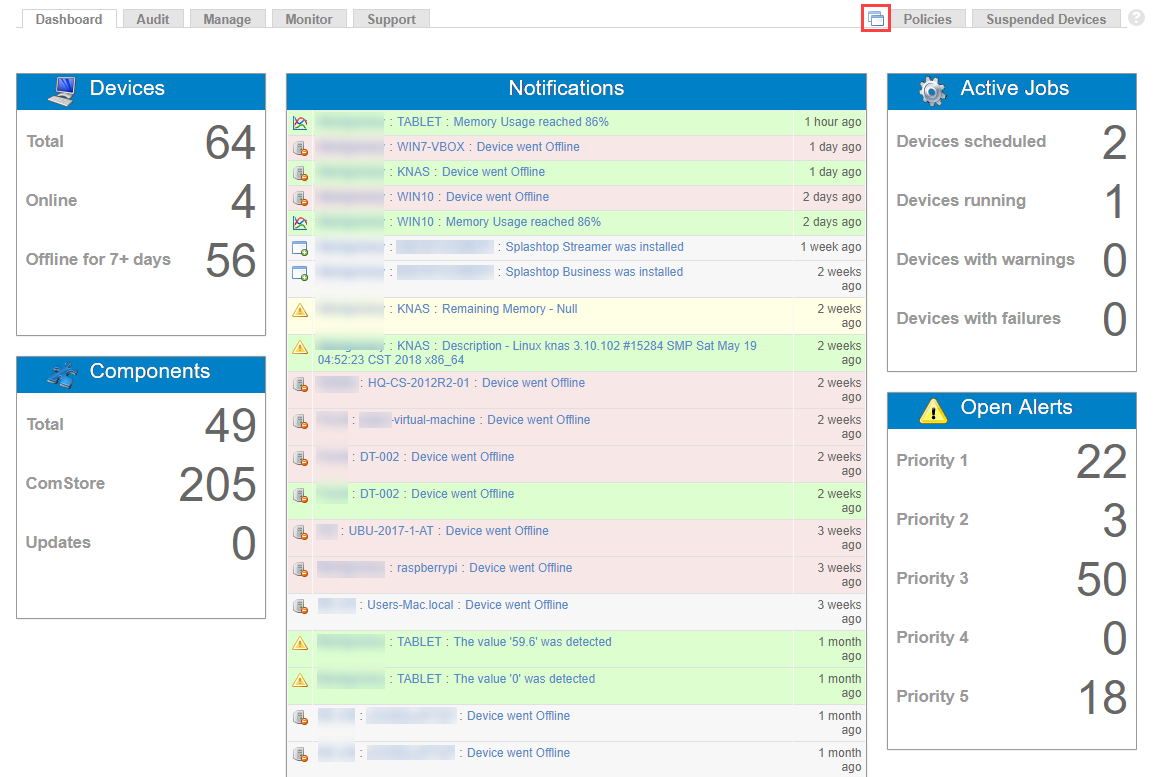
NOTE If you have the ConnectWise integration enabled, the Support tab is disabled. Refer to Round-trip ticketing.
The following information is displayed:
| Field | Description |
|---|---|
Devices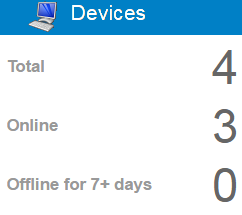 |
• Total - The number of all devices in the account. Refer to Device lists - Legacy UI. • Online - The number of devices that are online at the moment. • Offline for 7+ days - The number of devices that have been offline for more than 7 days. |
Components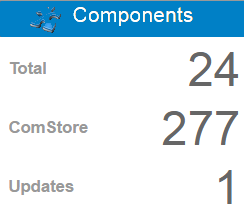 |
• Total - The number of components in your Component Library that you can find by clicking on the Components tab. For more information, refer to ComStore and components - Legacy UI. • ComStore - The number of components available in the ComStore. For more information, refer to ComStore - Legacy UI. • Updates - The number of components that have updates available. For more information, refer to ComStore - Legacy UI. |
| Notifications | Displays the alert notifications across the entire account. Hover over each line to see and/or click for further details: • Alert type icon - Displays an icon that identifies the type of alert that was triggered. Hover over it to see the name of the alert type. • Site name - The name of the site in which the alert was raised. Click the name to open the Site > Monitor page. Refer to About the Monitor Alerts page. • Device name - The hostname of the device for which the alert was raised. Click the name to open the Device > Monitor page. Refer to About the Monitor Alerts page. • Alert Information - Click the message to review the Alert Information. Refer to View and act on alert information. • Time stamp - Hover over the end of the row to see the exact date and time when the alert was raised. The priority level of the alerts is indicated by different colors. Hover over the Notifications header and then over the information icon  . For more information about the priority levels, refer to About the Monitor Alerts page. . For more information about the priority levels, refer to About the Monitor Alerts page.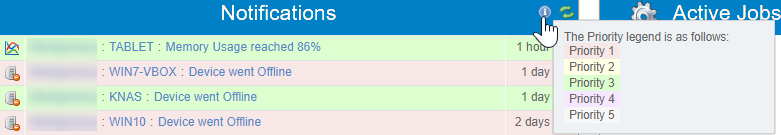 |
Active Jobs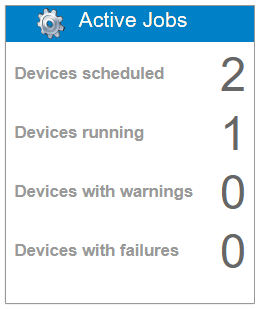 |
• Devices scheduled - The number of devices which currently have a job scheduled against them. If one device has two scheduled jobs, the device will be counted only once. • Devices running - The number of devices which are currently running a job. • Devices with warnings - The number of devices where post-conditions have been triggered when running the job. For more information, refer to Creating a component - Legacy UI and Post-Conditions. • Devices with failures - The number of devices that exited with an error when running the job. For more information, refer to Creating a component - Legacy UI and Post-Conditions. To see information about job results, refer to The job view - Legacy UI. |
Open Alerts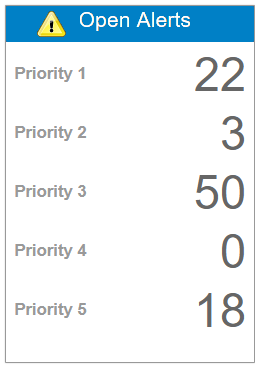 |
Displays the number of devices with open alerts of priority 1 - 5. Refer to About the Monitor Alerts page. |
 Refresh Refresh |
Hover over each section and click the Refresh icon to refresh the data displayed. NOTE In Kiosk Mode, you can also use the Refresh Now button on the top of the page. |


