Report scheduler - Legacy UI
PERMISSIONS Refer to REPORTS > Active Reports in Security Level Details - Permissions
NAVIGATION Legacy UI > Reports > New Report
NAVIGATION Legacy UI > Site lists > select one or more sites > Schedule reports
NAVIGATION Legacy UI > Device lists > select one or more devices > Schedule reports
NAVIGATION Legacy UI > device summary > Actions > Schedule reports
NAVIGATION Legacy UI > Device Audit > Actions > Schedule reports
Refer to Creating a report in Reports.
About the report scheduler
Datto RMM's reporting engine has been designed to help you create accurate, flexible, and elegant reports that you can provide to your end users or use internally. Exports are also available for use in third-party applications for deeper analysis.
Reports and exports can be created in the report scheduler on the Reports > New Report page.
Design and format
The report scheduler is flexible and allows you to configure various options in both reports and exports. Both reports and exports are delivered via email.
Reports
Every report is delivered in PDF format and follows a specific design guideline on the cover page:
- Report Name
- Description
- Create Date: DD MON YYYY. Time and time zone information is added after the date, for example, 26 JAN 2022 11:03 (GMT).
- Sites
- Filters
- Device Name
- Groups
- Devices: Shows the total number of devices listed in the report.
NOTE A maximum number of 25 sites/filters/device names/groups are listed on the cover page. If more than 25 have been selected of any of these items in the report targets, it will be indicated in parentheses at the end of the respective list, for example, (5 more sites) or (10 more filters).
Exports
Exports are delivered in CSV format so that you can use them according to your business needs (for example, in third-party applications).
NOTE Export CSV files are encoded in UTF-8 with a byte-order mark.
NOTE Microsoft Excel is unable to properly display UTF-8 compliant CSV files when they contain non-English characters.
Time zone
Reports and exports respect the account time zone that can be configured in either the legacy UI or the New UI. Refer to Time Zone in Your user account - Legacy UI (legacy UI) or Time zone in Account Settings (New UI).
How to...
- Go to Reports > New Report.
NOTE Alternatively, you can access the same page from any of the paths listed above, and the selected sites or devices will be added as report targets. For more information, refer to Report Targets.
- Configure the following sections:
- General
- Select Report
- Report Targets
- Email Recipients
See below for further details on each section.
| Field | Description |
|---|---|
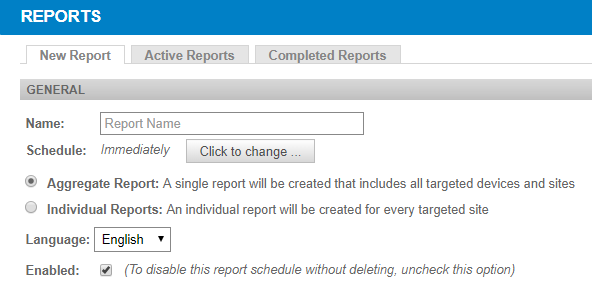
| Name | Enter a name for the report schedule. By default, the following name is populated: Scheduled Report for [Username] This field has a limit of 100 characters. NOTE You can identify your active and completed reports by this name. Refer to Active and completed reports - Legacy UI. |
Schedule |
By default, the report is executed immediately. To schedule the report for later or for recurring instances, click Click to change... Select one of the following options: Immediately - The report will run as soon as it is saved. At selected date and time - The report will run once at the selected date and time. Weekly - The report will run every week on all selected days at the time indicated in the Start field. Monthly - The report will run in the selected months on the selected days, at the time indicated in the Start field. Monthly day of week - The report will run in the selected months on the specified occurrence of the selected days of the week, at the time indicated in the Start field. Yearly - The report will run on the selected day (1 - 365) each year, at the time indicated in the Start field. Click OK to save your selection. |
| Aggregate Report | When multiple sites are included in the targets, you can use this option to create a single report. All targeted sites and devices will be included. |
| Individual Reports | Choose this option to create an individual report for each targeted site. |
| Language | Set the language of the report to one of the following languages:
|
| Enabled | The report schedule is enabled by default. Clear the check box to disable the report schedule without deleting it. |
Various report categories and a number of reports and exports are available. Depending on the report or export, you can specify which data you want to include, such as date range, columns, filters, or thresholds.
- Expand any of the following categories:
- Executive
- Audit
- Monitoring
- Patch Management
- Activity
- Export
- Select any of the reports or exports in any of the categories.
- Configure the Report Options.
See below for further information on each report and export.
| Report Name | Description | Report Options |
|---|---|---|
|
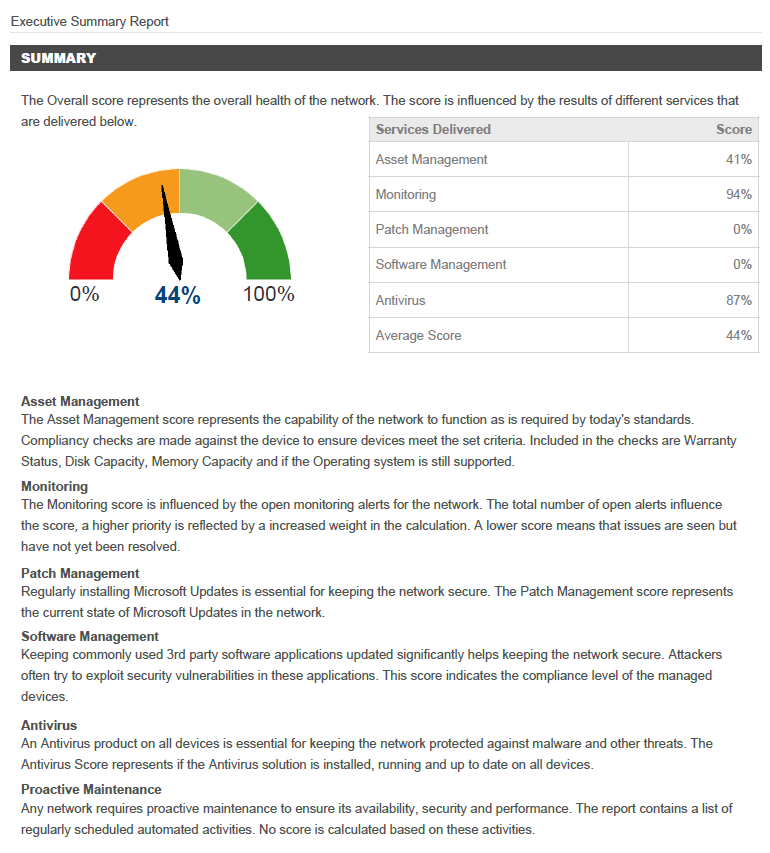
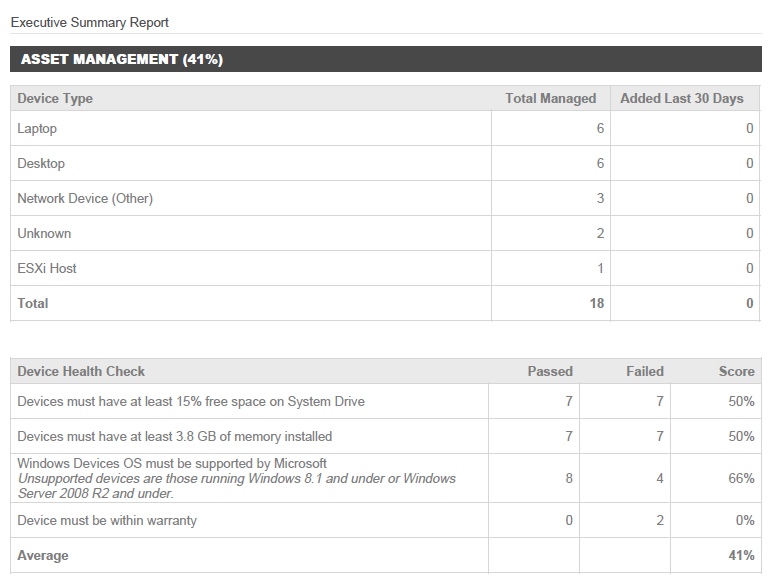
This report shows the health of the delivered managed services. NOTE Patch Management data is only available for Windows devices. NOTE Software compliance data is only available for Windows and macOS devices. |
Configure the following options:
A device will pass the health checks if they meet the requirements specified above. NOTE If a system drive cannot be identified on a device (including Windows devices that have not yet been audited and non-Windows devices), the free space calculation is based on all fixed drives, and device health is reported based on any of the drives failing the threshold. Select any or all of the following sections to be included in the report. (All are selected by default.)
NOTE For information about which operating systems are no longer supported by Microsoft, refer to Microsoft Lifecycle Policy.
|
|
|
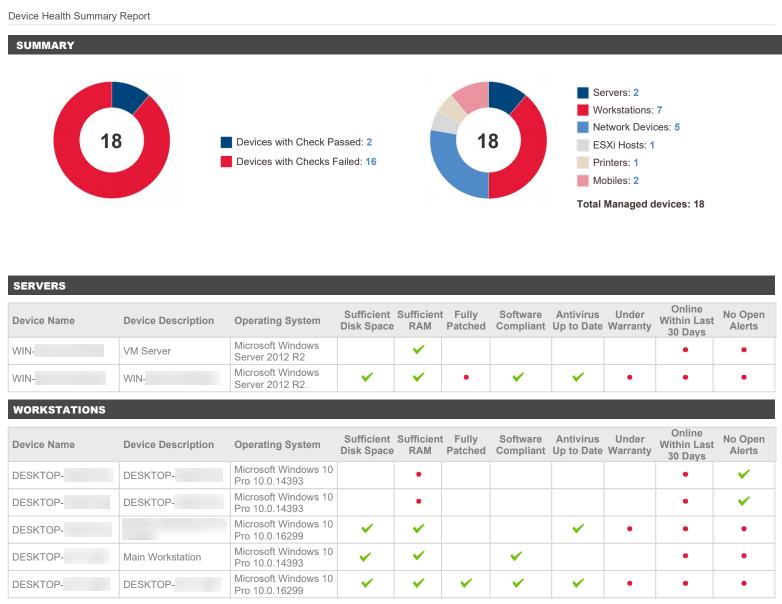
This report shows the health of the targeted managed devices. It displays the total number of devices that passed or failed all health checks. Problem areas include whether the device is fully patched, is software compliant, has up-to-date antivirus, if it's been online within the last 30 days, or if it has open alerts. The health checks vary depending on the device type:
The following icons are displayed in the report:
NOTE Patch Management data is only available for Windows devices. The Fully Patched field is left blank for all non-Windows devices or if a Windows device is not targeted by a patch policy. If a device has approved patches, the Fully Patched field displays a red dot ● as the device is not fully patched. NOTE Software compliance data is only available for Windows and macOS devices. The Software Compliant field is left blank if the device's Software Status is Unmanaged. Refer to Software status |
Configure the following options:
A device will pass the health checks if they meet the requirements specified above. NOTE If a system drive cannot be identified on a device (including Windows devices that have not yet been audited and non-Windows devices), the free space calculation is based on all fixed drives, and device health is reported based on any of the drives failing the threshold. |
|
|
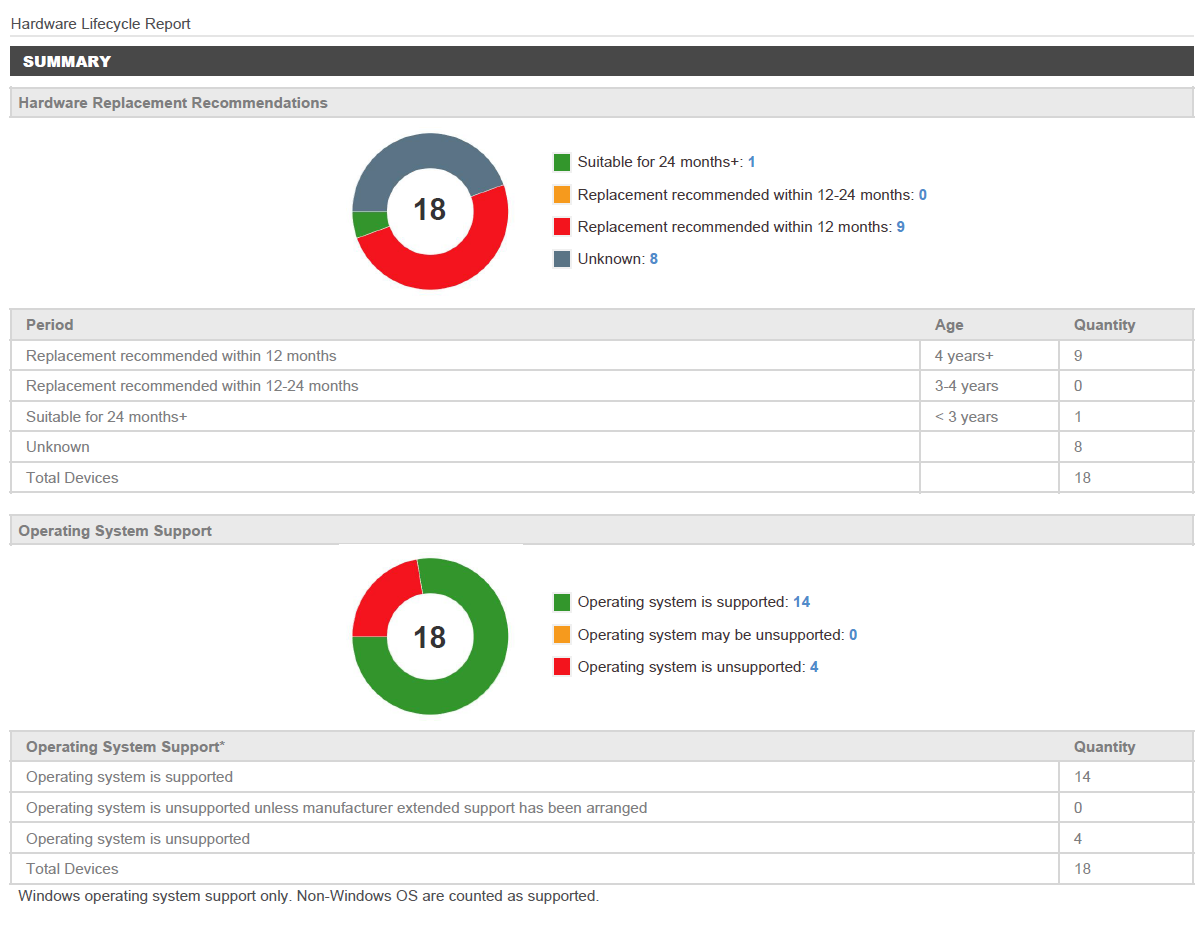
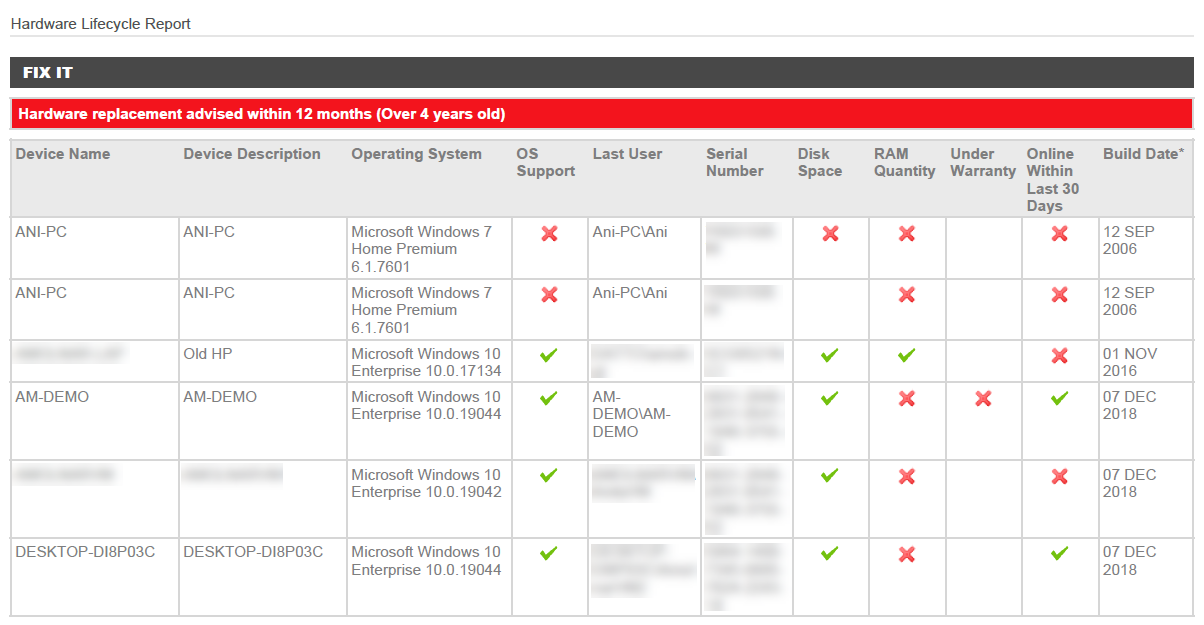
This report can be used to give a clear rundown of inventory nearing the end of its productive lifecycle. The targeted devices are grouped by site and sorted by hardware age (Build Date) first and device name second. Sites are listed in alphabetical order. NOTE Build Date is based on the BIOS release date. While this is the best metric available, the data should not be treated as definitive since it is not always available.
The following icons are displayed in the report: NOTE For information about which operating systems are no longer supported by Microsoft, refer to Microsoft Lifecycle Policy. |
Configure the following options:
A device will pass the health checks if they meet the requirements specified above. NOTE If a system drive cannot be identified on a device (including Windows devices that have not yet been audited and non-Windows devices), the free space calculation is based on all fixed drives, and device health is reported based on any of the drives failing the threshold. |
| Report Name | Description | Report Options |
|---|---|---|
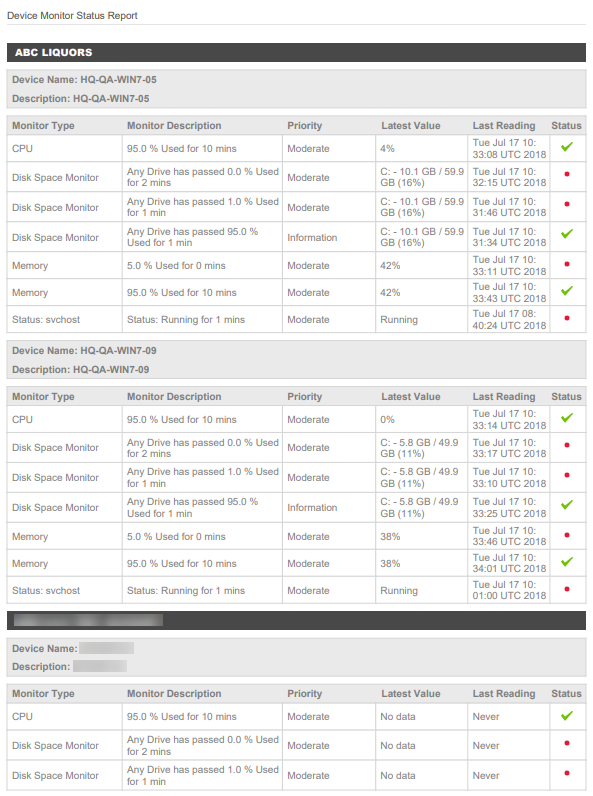
|
This report shows the last values and history of individual monitors applied to the targeted devices. The devices and monitors are sorted in alphabetical order within each site. |
Select any of the following monitor statuses: Select any of the following monitor types: |
|
|
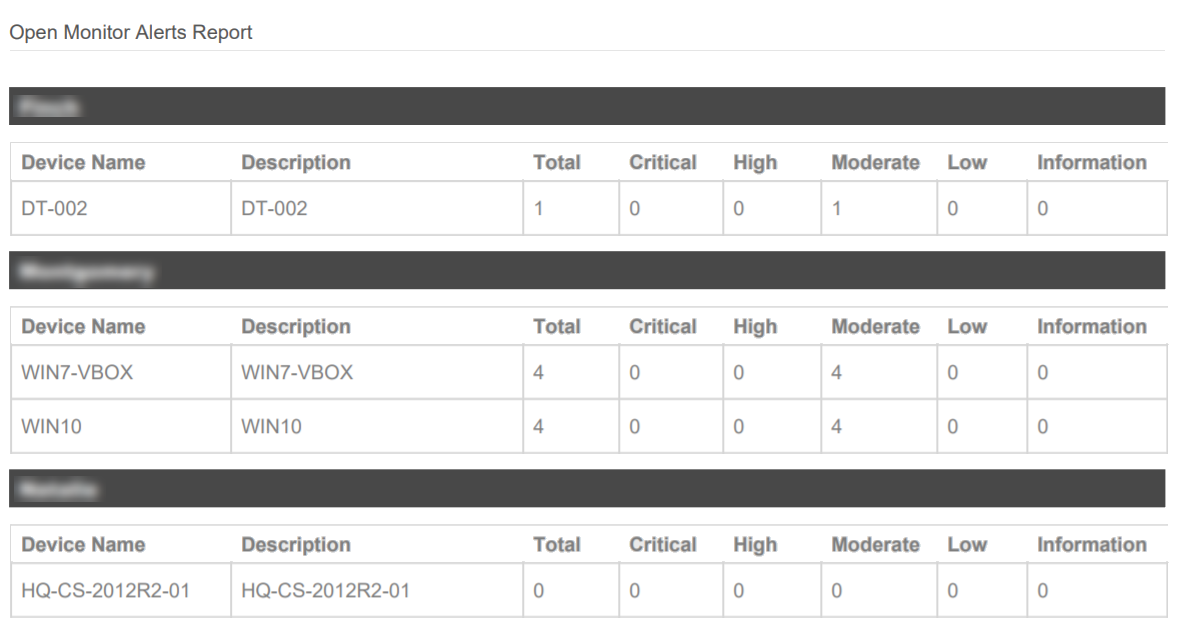
This report shows the current open alerts by device. Devices are grouped by site and sorted by total number of alerts. |
N/A |
|
|
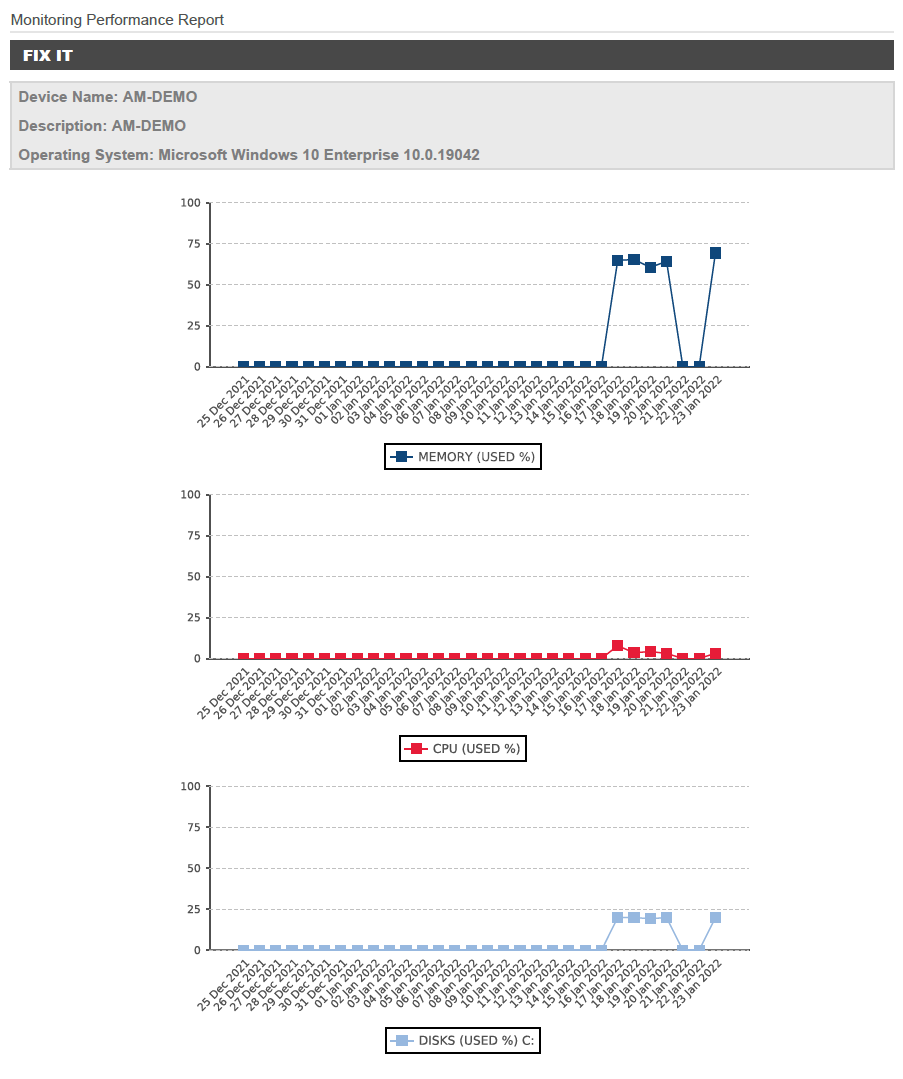
This report shows the CPU, disk, and memory graphs for the targeted devices for the past 30 days. NOTE These graphs are only available for devices with an Agent installed. Therefore, the number of Targeted Devices on the cover page may differ from the actual number of devices listed in the report. |
Select any or all of the following options:
|
NOTE Patch Management data is only available for Windows devices.
| Report Name | Description | Report Options |
|---|---|---|
|
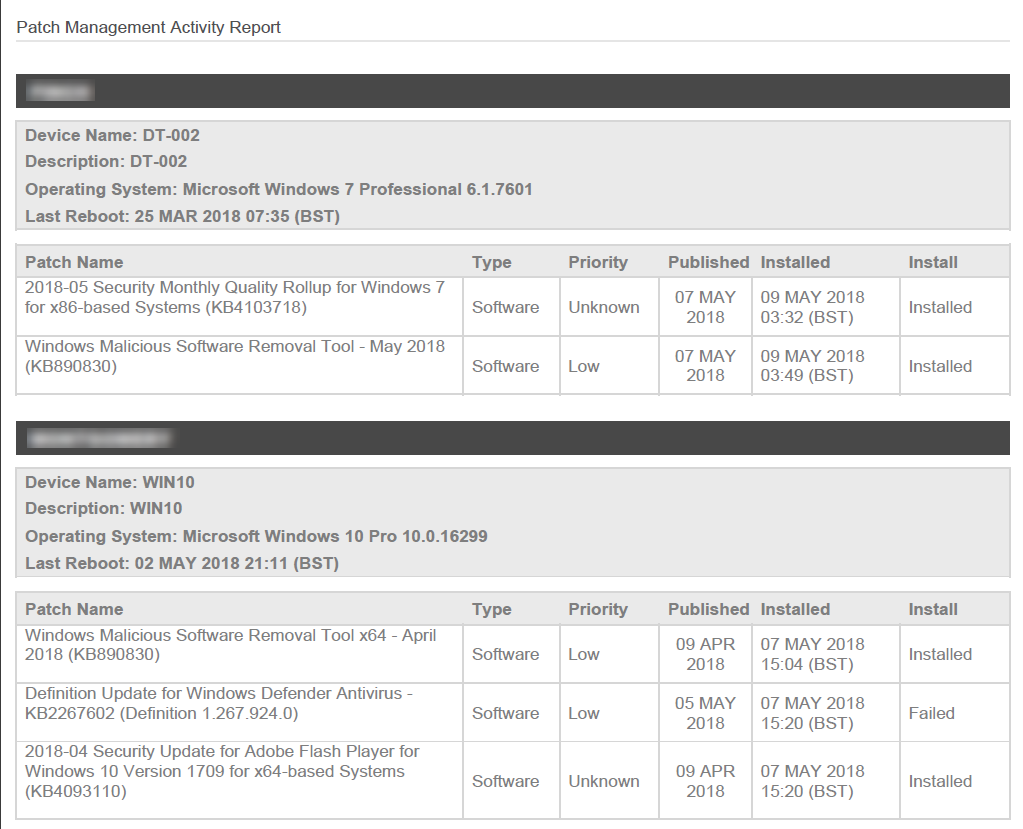
This report shows patch activity for the targeted devices in the selected date range. Devices are grouped by site and patches are sorted by installed date (ascending). |
Select one of the following date ranges:
Select either or both of the following install statuses:
|
|
|
This report gives a high-level overview of the installed, pending, and not approved patches of the targeted devices. Patches are sorted by status and grouped by device type within each site. Servers are listed on top. |
Click Apply filter and select one of the following options:
When the Show only selected patches option is applied, you can click Edit filter in the Report Options to modify your selection. Select any or all of the following Patch Details Options:
|
|
|
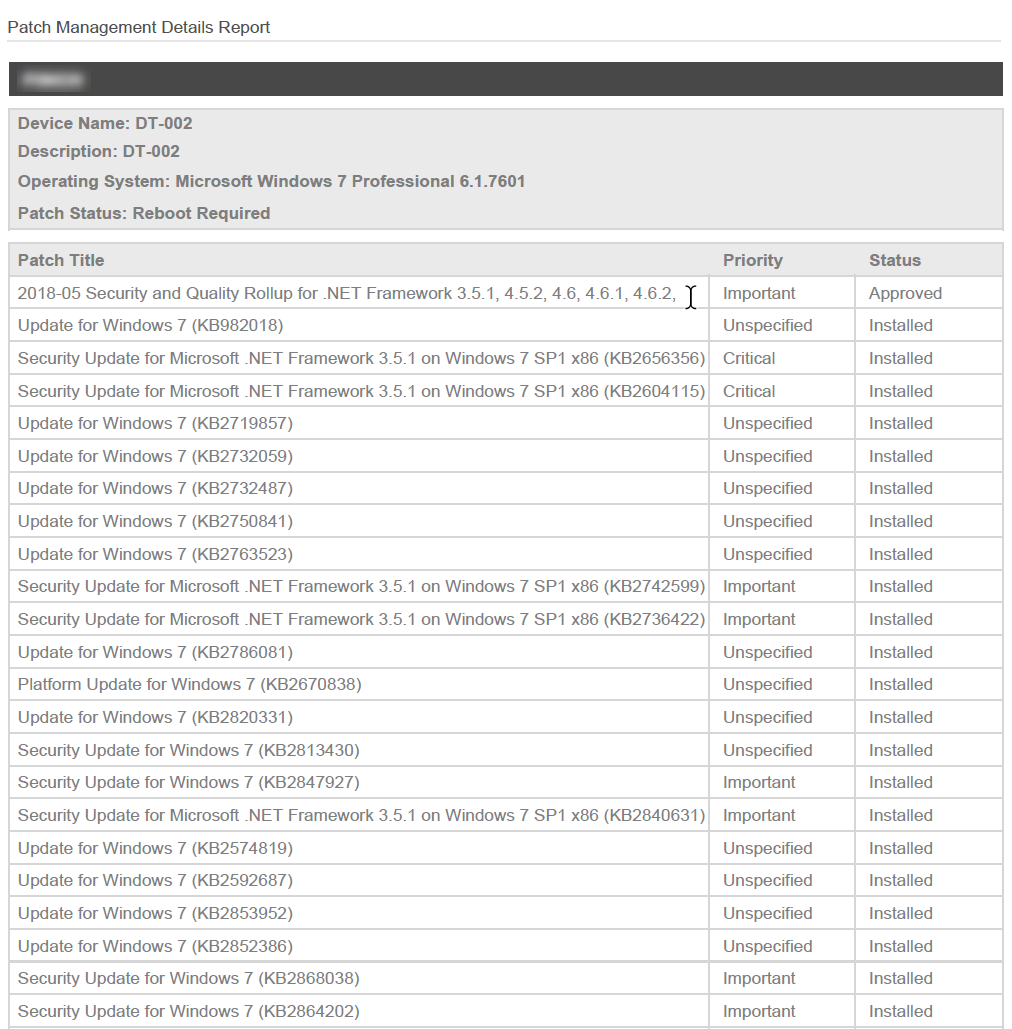
This report shows patch status by device. A patch summary pie chart is displayed at the top of the report. Patches are sorted by status and grouped by device type within each site. Servers are listed on top. |
N/A |
| Report Name | Description | Report Options |
|---|---|---|
|
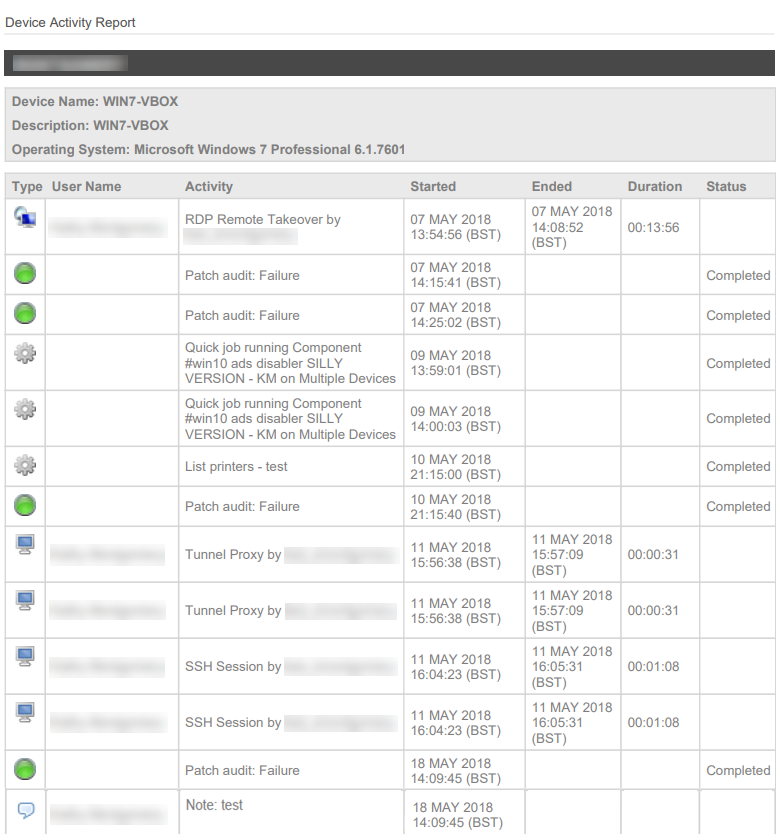
This report shows the selected activities performed on the targeted devices in the selected date range. Devices are grouped by site and activities are sorted by start date (ascending). Notes added to a device in the UI or Agent Browser are shown in the report in the Activity column with the heading Note followed by the contents of the note. The time a note was added to a device is also displayed. |
Select one of the following date ranges:
Select any or all of the following Activity Filters:
IMPORTANT The Mobile Device Management (MDM) feature is no longer available. For more information, refer to this Kaseya Community post. |
| Export Name | Description | Report Options |
|---|---|---|
|
Admin Activity |
This export shows a line-by-line list of every activity performed by the selected Administrators in the selected date range. IMPORTANT This export is only available to Administrators. NOTE The selected targets will not impact the results of this export but you must define a target to be able to save the report. |
From the drop-down list, select any or all of the Administrators. Select one of the following date ranges:
Click the Column Chooser icon to customize which columns to include in the export. |
|
Device Change Log |
This export shows the selected types of changes in the device change log of the targeted devices in the selected date range. |
Select one of the following date ranges:
Select any or all of the following change types:
Enter any text in the Changed audit field contains field to filter for information in the change log. Click the Column Chooser icon to customize which columns to include in the export. |
|
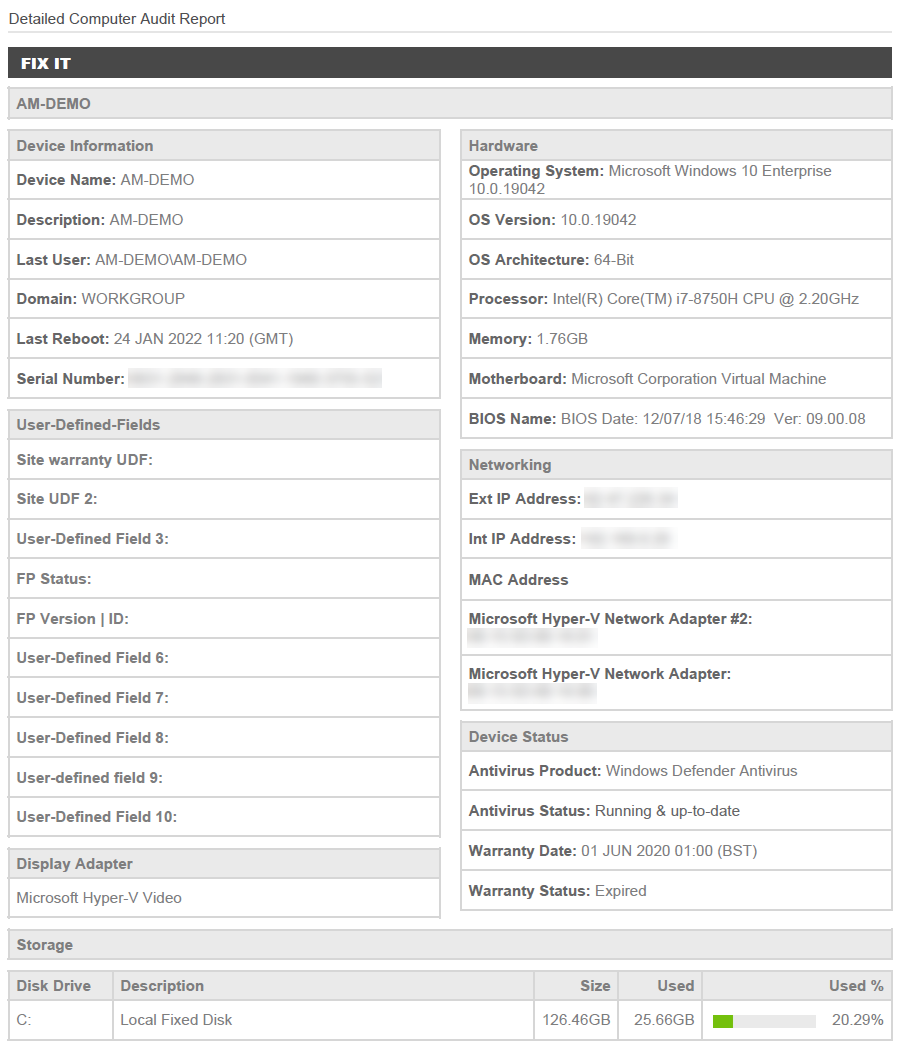
Device Details |
This export shows all available device information of the targeted devices. |
Click the Column Chooser icon to customize which columns to include in the export. |
|
Device Activity |
This export shows a line-by-line list of the selected activities performed on the targeted devices in the selected date range. |
Select one of the following date ranges:
Select any or all of the following Activity Filters:
IMPORTANT The Mobile Device Management (MDM) feature is no longer available. For more information, refer to this Kaseya Community post. Click the Column Chooser icon to customize which columns to include in the export. |
|
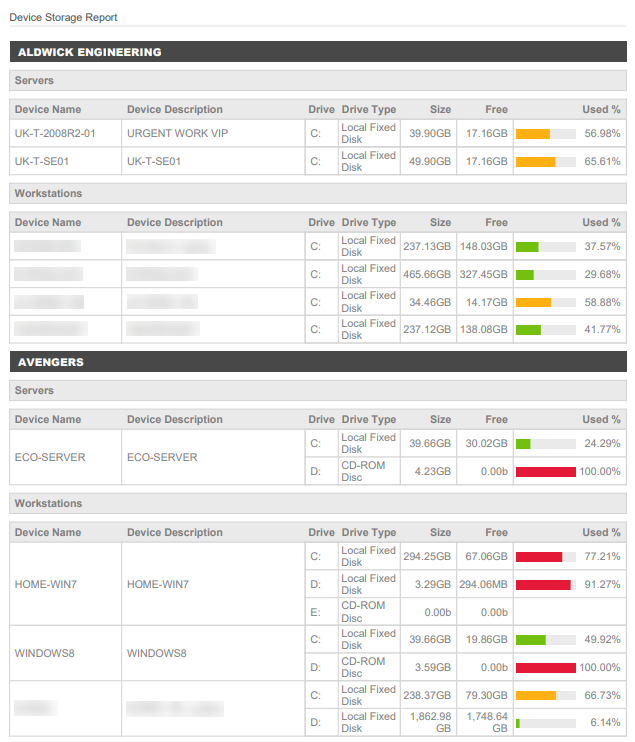
Device Storage |
This export lists all available disks on the targeted devices, including their available disk space. |
Click the Column Chooser icon to customize which columns to include in the export. |
|
Microsoft Audit |
This export shows the information required by Microsoft for licensing purposes. It includes Microsoft operating systems, applications, and device details. |
Click the Column Chooser icon to customize which columns to include in the export. |
|
This export shows all alerts matching your criteria for the targeted devices in the selected date range. |
Select one of the following date ranges:
Select one of the following alert statuses:
Select one of the following Monitor Types:
Click the Column Chooser icon to customize which columns to include in the export. |
|
|
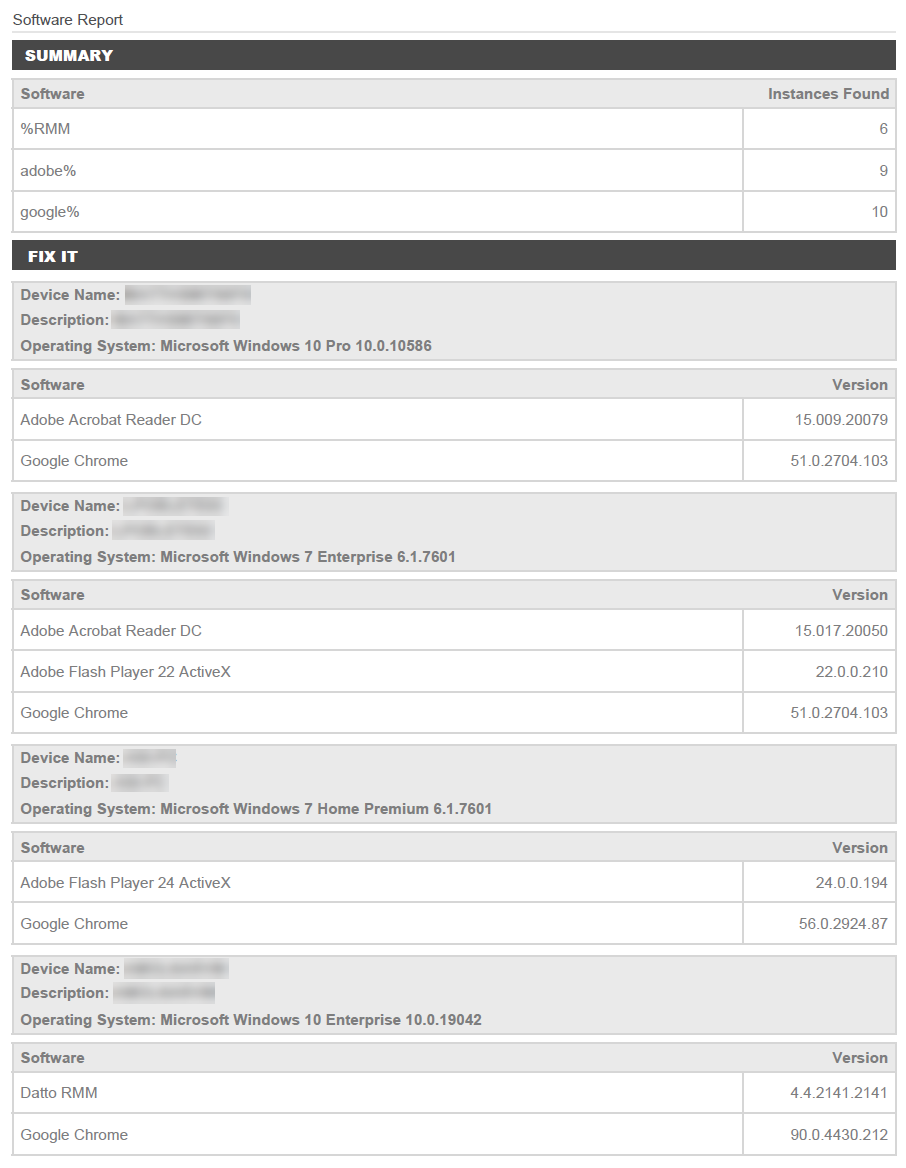
Installed Software |
This export shows installed software and versions per device matching your criteria. |
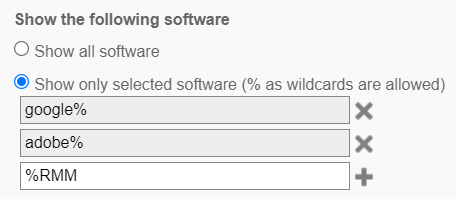
Click Apply filter and select one of the following options:
When the Show only selected software option is applied, you can click Edit filter in the Export Options to modify your selection. Click the Column Chooser icon to customize which columns to include in the export. |
|
Patch Details |
This export shows a list of all patches of the selected patch statuses for the targeted devices. NOTE Patch Management data is only available for Windows devices. |
Select any or all of the following patch statuses:
Click the Column Chooser icon to customize which columns to include in the export. |
|
Device Patch Summary |
This export shows devices with pending patches at the device level. NOTE Patch Management data is only available for Windows devices. |
Click the Column Chooser icon to customize which columns to include in the export. |
|
This export shows the total number of devices per site, grouped by device type. |
Click the Column Chooser icon to customize which columns to include in the export. |
- Click Add targets.
- Select one of the following Target Types and select any number of items within it.
- Sites
- Devices
- Site Groups
- Default Device Filters - When selected, the sites that you have access to will be listed below the list of filters. You can select any number of Default Device Filters and any number of sites to target the selected filters at. If you have access to all sites in the account, you will see an All Sites option as well.
- Custom Device Filters
- Device Groups
- Site Device Groups
- Site Device Filters
NOTE You can only target sites, devices, groups, and filters that you have access to.
The page lets you:
- Search - As you type, the search results are narrowed to match your search string.
- Show entries - Select to show 10 / 25 / 50 / 100 entries per page. 10 is selected by default.
- Select pages - Click a page number or click Previous / Next to jump to the previous / next page of results.
- Once you have selected the items, click Add.
Your selection is now added to the Report Targets section. - To add more items from other target types, repeat the steps. You can add any number of items and target types to the report targets.
- To remove a target from the list, click the Delete icon
 .
.
Reports and exports are delivered via email. Configure the following email options:
| Field | Description |
|---|---|
| Subject | This field is automatically filled in based on your report configuration; however, you can modify it. Aggregate reports have the subject line Scheduled Report: Aggregate Report for [username] by default. Individual reports have the subject line Scheduled Report: [Report Name] for [username] by default. The Report Name is the name of the first report or export in the list. |
| Body | This field is automatically filled in based on your report configuration; however, you can modify it. By default, the email body contains the names of the included reports and exports and the username of the user who created the report. |
| Recipients | Configure any of the following options: • Send to Default Account Recipients: Select the check box to send the report to all Email Recipients configured in the Email Recipients section in Global Settings, and make sure those recipients have the Reports option selected. • Send to Default Site Recipients: Select the check box to send the report to all recipients listed in Email Recipients configured at the site level for targeted sites, and make sure those recipients have the Reports option selected. • Additional Recipients: The name and email address of the report creator is automatically added. To add another recipient, enter a name and an email address and click the plus sign NOTE The email field accepts the following characters: |
TIP If you wish to customize the email subject line and body, we recommend that you do it as the last step before saving the report. Making changes to the type and number of reports or exports will automatically override these fields.
- Click Save. The report schedule is now created and you are directed to the Reports > Active Reports page.
If the report or export was scheduled for immediate delivery, it will be generated and emailed to all recipients within a few minutes.
Reports are sent from the email address reports@rmm.datto.com. This can be overridden by an alias sender name configured in the Email Settings section in Account Settings - Legacy UI (legacy UI) or in the Email Settings section in Global Settings (New UI).
Reports are attached to the email in PDF/CSV format. However, if the email including report attachments exceeds 10 MB, the email will contain a Please download the report(s) from here link. Click the link to download a ZIP file of the report or reports. The download link expires after seven days.
Reports or exports scheduled for a one-time or recurring delivery in the future are listed on the Reports > Active Reports page. Completed reports or exports are listed on the Reports > Completed Reports page. For more information, refer to Active and completed reports - Legacy UI.
Active and completed report schedules can be edited or deleted on the Reports > Active Reports or Reports > Completed Reports page, respectively. For more information, refer to Active and completed reports - Legacy UI.
