Networks
PERMISSIONS Refer to Sites > Sites in Permissions.
NAVIGATION Sites > All Sites > click the name of a site > Network (left navigation menu)
About
When configuring a site's Network page, you can set up a Network Node, define network scanning ranges, provide credentials, and automatically or manually onboard discovered devices. The Network Node device that you select to perform the network scanning must have a Managed Agent installed, and should be a device that has a high uptime, such as a server.
- Only desktops, servers, and laptops with up-to-date audit information may be nominated as Network Nodes.
- The following Operating Systems are supported: Windows, macOS, Linux. For more information on the supported versions of these operating systems, refer to Supported operating systems and Agent requirements.
NOTE Linux Network Nodes are not able to perform network scans. Manual network device enrollment must be used when using exclusively Linux Network Nodes. Refer to Enroll an SNMP-enabled device.
- For information about Network Node requirements for ESXi monitoring, refer to Managing and monitoring ESXi devices.
| Type of Network Scan | Requirement |
|---|---|
| A Network Node scans its own subnet |
NOTE Devices without a MAC address can be manually onboarded but not automatically onboarded. Refer to Onboard Devices and Automatically Onboard within Site Settings. |
| A Network Node scans a user-specified additional subnet |
NOTE Devices without a MAC address can be manually onboarded but not automatically onboarded. Refer to Onboard Devices and Automatically Onboard within Site Settings.
|
NOTE In cases where there is a particularly rigorous network security, port 13300 is used for Agent discovery. Refer to Port usage.
Devices that you want to onboard via Network discovery must meet the requirements listed below.
Windows requirements
This method of deployment has prerequisites that weaken the overall security of the environment. It should only be used if Active Directory deployment is not an option.
IMPORTANT In the past, PsExec has been utilized by some viruses to remotely run malicious code. PsExec itself is not a virus, nor does it run malicious code on its own. Adding a registry key to enable access to the ADMIN$ share, making exceptions to any antivirus product, and opening ports is by definition going to weaken the overall security of the environment. By using this method of deployment, you acknowledge that you are aware of this.
TIP After you have deployed the Agent, reverse all changes you made to allow Agent deployment.
| Requirement | Description |
|---|---|
| Enable remote access to the Admin$ share | Starting with Windows Vista, UAC has by default required elevated privileges to access the administrative shares. Details on this can be found here: Microsoft Support Article (951016). You can enable this share either by accessing the Microsoft support article above and following the instructions, or you can copy the following into an Administrative Command Prompt window: reg add HKLM\SOFTWARE\Microsoft\Windows\CurrentVersion\Policies\System /v LocalAccountTokenFilterPolicy /t REG_DWORD /d 1 /f |
| File and printer sharing | File and printer sharing must be enabled on the devices you wish to deploy to. Ports 445 and 139 inbound must be open. |
| Password | You cannot authenticate as a user with a blank password. The user account with the correct permissions to enable an install must have a password to work using PsExec. |
| Antivirus | This process assumes that all antivirus programs are configured to allow the use of PsExec, which can stop the use of those programs. |
macOS requirements
NOTE Network deployment to macOS devices is not possible at this time. It is recommended that you onboard macOS devices using a manual install, or using a third party. Additionally, Microsoft Intune can be used to deploy to macOS devices.
Network configuration and discovery
For devices to be discovered on your network, an online device within your site must be nominated as a Network Node with scanning enabled. This device can be a Windows, macOS, or Linux device. Click Add Device. For more information about how to add a device, refer to Adding a device. 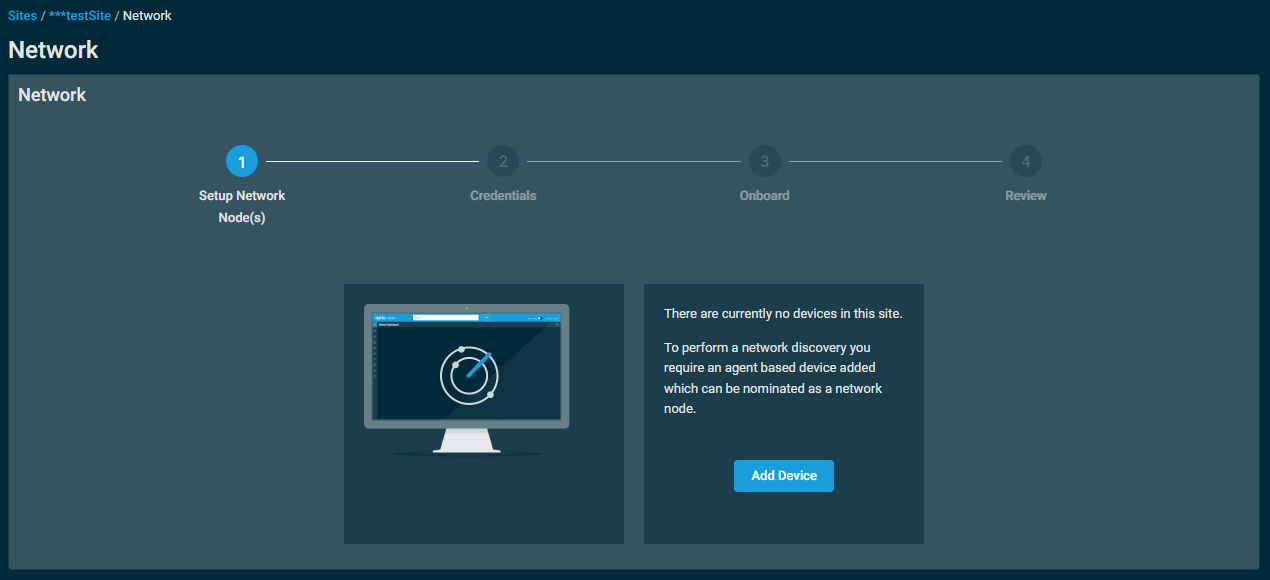
Once one or more devices are added, Datto RMM will check for the first Agent to come online. If assigned Network Nodes with scanning enabled are offline, you will see a list of those devices. Otherwise, a message will display stating that no online network node candidates were found. 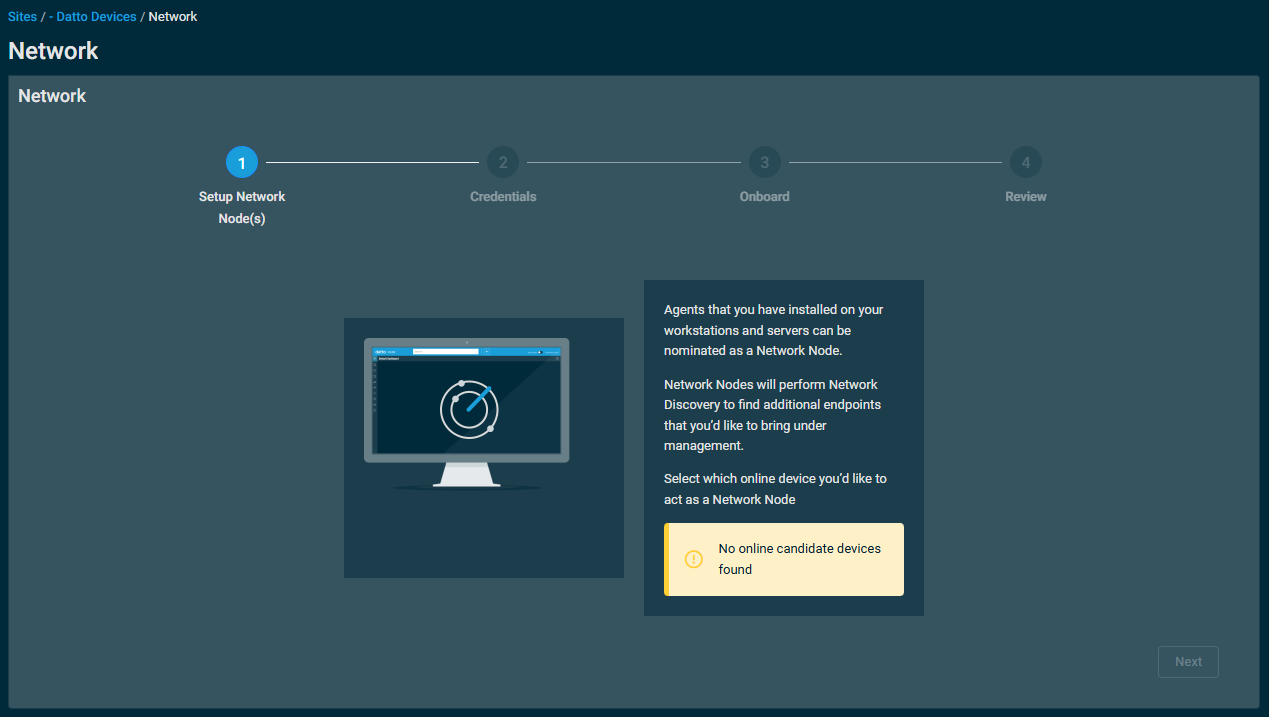
IMPORTANT It is strongly recommended that a device acting as a DHCP server NOT be nominated as Network Node with scanning, as network topology mapping requires UDP port 67 to be free for the identification of network devices using DHCP fingerprinting.
IMPORTANT If present, VOIP (for example, IP Phone) traffic should be VLAN-segregated from normal data traffic on the network as per industry practices. Doing so will limit any impact on call quality during network scanning routines.
NOTE Devices must support the industry-standards RFC 1493 and RFC 4363 in order for the network topology map to be created.
NOTE Datto Access Points do not support SNMP; therefore, mapping of these devices in the network topology is not supported.
NOTE If a Network Node is awaiting device approval due to an Agent encryption key change request, any associated network devices will appear offline until the Network Node is approved. For more information, refer to Agent Encryption Key Changed.
To initiate a network discovery, perform the following steps:
- Setup Network Node(s): Select the device you wish to nominate as the initial Network Node from the drop-down menu. The device must be online.
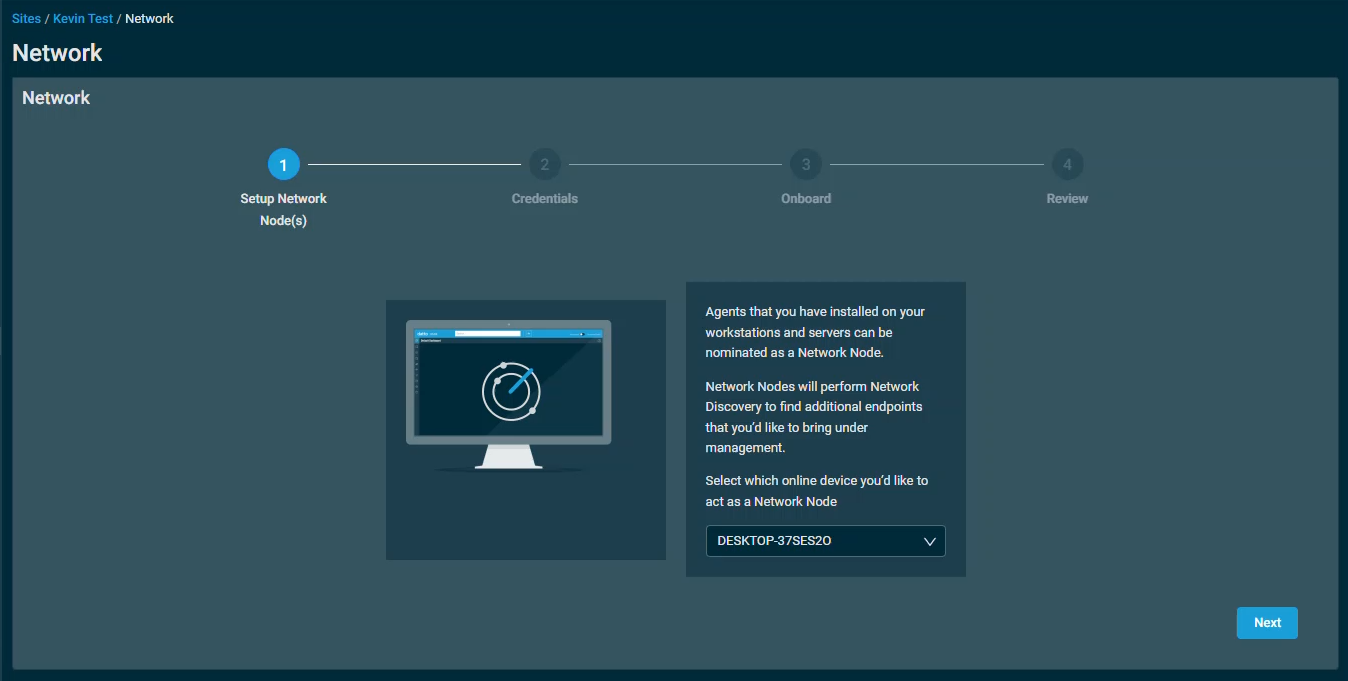
Click Next to continue. - Credentials: Select an existing credential or create one by clicking Create Credential. Refer to Credentials.
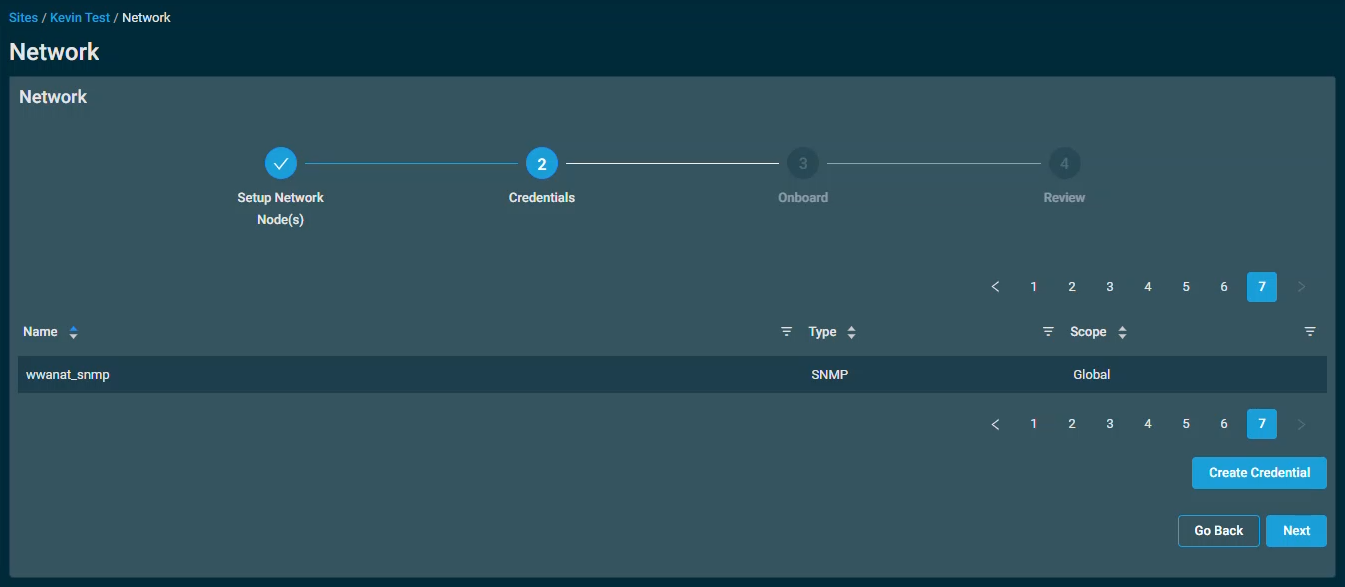
Click Next to continue or Go Back to return to the previous step.
- Onboard: Select which device types to automatically onboard to Datto RMM as devices are discovered. Devices will appear within Datto RMM in the same way as other Managed devices, and any global or site Monitoring policies will be applied to the onboarded devices.
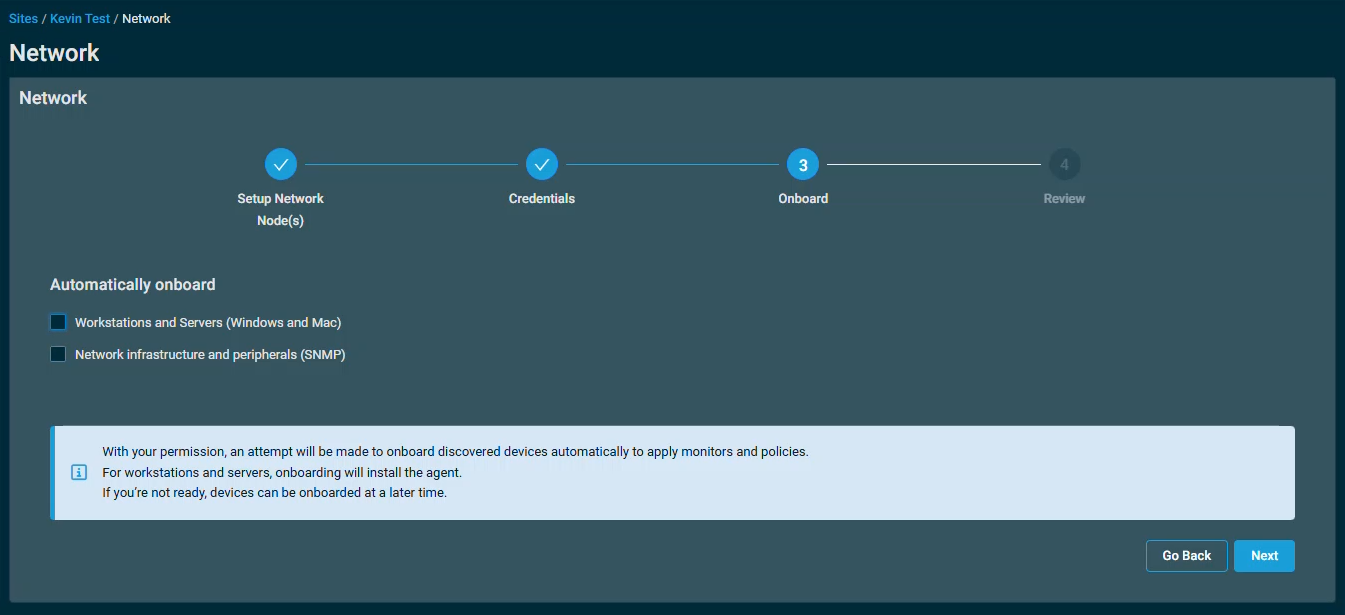
Devices can also be onboarded at a later date by configuring automatic onboarding after network discovery, or manually. For more information, refer to Automatically Onboard within Site Settings and Onboard Devices.
NOTE Additional Network Nodes can be configured after initial setup. Refer to Managing Network Nodes and additional subnets
IMPORTANT Ensure required credentials are configured during this step for best results.
NOTE All options require credentials to be configured before onboarding. Refer to Credentials.
NOTE Devices without a MAC address can be manually onboarded but not automatically onboarded.
NOTE ESXi hypervisors are no longer included in automatic onboarding to prevent unintended lockouts of ESXi accounts when credentials are regularly tested from one or more Network Nodes on a site during Network Discovery scans.
- Click Next to continue or Go Back to return to the previous step.
- Review: Review the network details and then click Initiate Discovery.
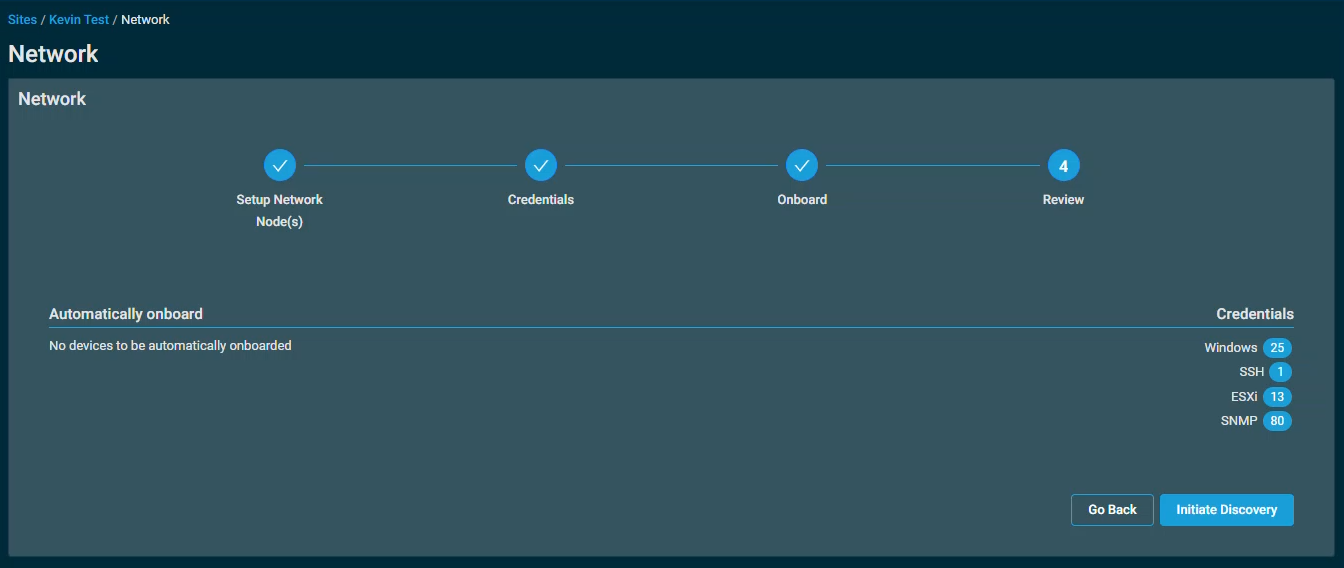
Once initiated, scanning will begin. It may take some time for the scan to complete depending on how large your network is. 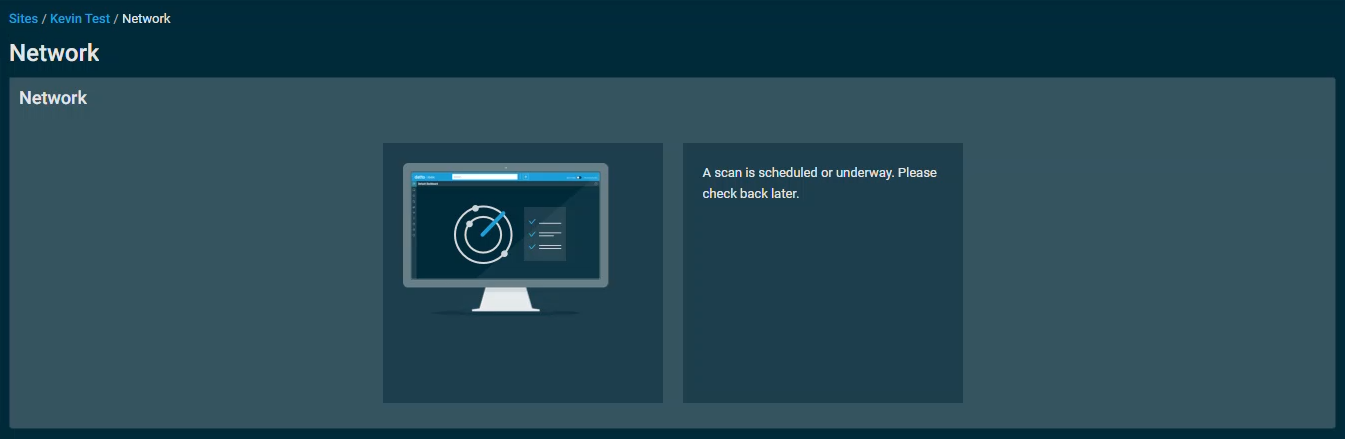
The Discovered Devices, Topology Map, and Network Nodes tabs will be available once initial network discovery has been completed. You will need to refresh the page to view the results. Select a tab from the list below to learn more:
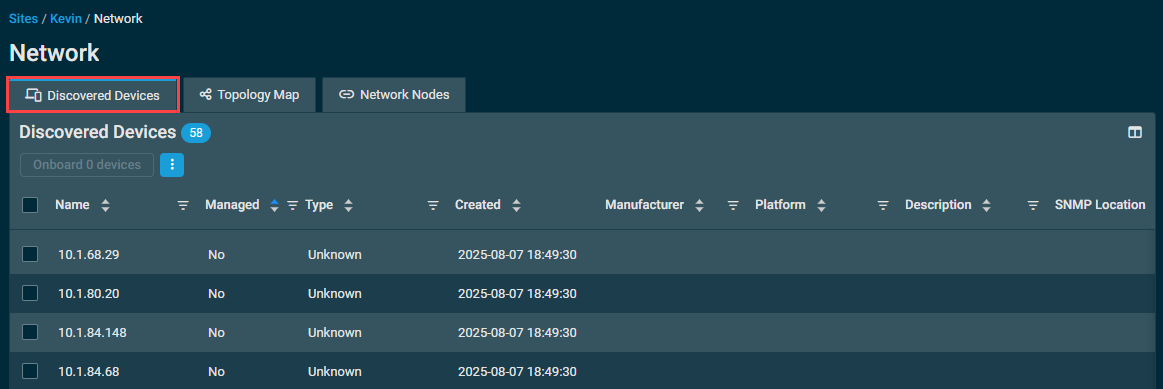
To view a list of discovered devices, select the Discovered Devices tab at the top of the Network page.
The Column Chooser icon  allows you to select which columns should be visible in the list. Refer to Column Chooser field definitions for descriptions of all of the available fields.
NOTE If devices with the same MAC address but different IP addresses are detected, only one device will appear on the Discovered Devices page based on the device's MAC address.
There are various actions you can perform:
| Action Button | Description |
|---|---|
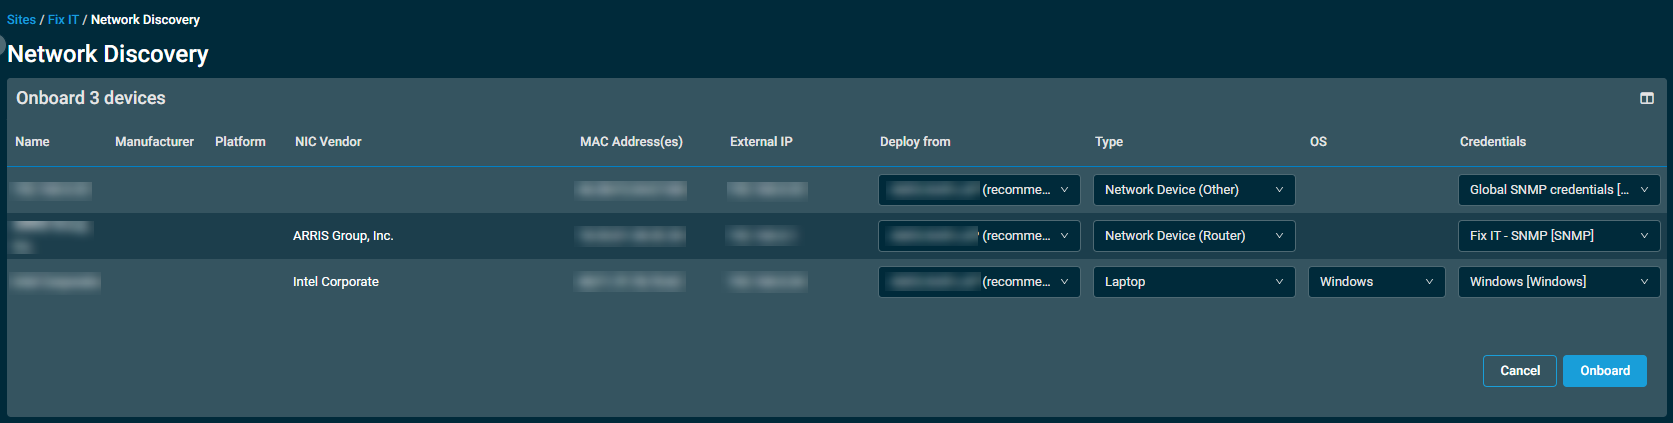
| Onboard Devices | To learn which requirements devices must meet to be onboarded, refer to Requirements to onboard a device. Select one or more devices in the list to onboard to Datto RMM. Datto RMM will then attempt to install the appropriate Agent on the devices (Windows only) or to enroll the network devices (SNMP/ESXi). If there are no Network Nodes in the network, the button will be disabled. Enter the following information: Deploy from: The Network Node from which the Network discovery was initiated is selected by default. A different Network Node can be selected if there are multiple available in the network. Type: Required field that cannot be left as Unknown. Choose from one of the following device types: • Desktop • Laptop • Server • ESXi Host • Network Device (Other) • Network Device (Router) • Network Device (Switch) • Network Device (UPS) • Network Device (Firewall) • Network Device (IP Phone) • Network Device (NAS) • Network Device (Network Appliance) • Network Device (SAN) • Printer NOTE Datto network device types (Datto Access Point, Datto Managed Power, Datto Switch, and Datto Continuity) are not supported. OS: Required field. Once a device type is selected, choose the appropriate Operating System (OS). Applies to Desktop, Laptop, or Server device types only. Click Onboard and then OK to confirm. |
| Export Selected Rows to CSV | In the confirmation dialog box, select whether to show table headers in the file by toggling the Show table headers in the exported CSV button. Click Confirm to download the file. Any column selections, filters, and sorting that have been applied to the table will also be applied in the CSV file. A maximum number of 500 rows can be exported to a single CSV file. The Export all (max. 500) rows to CSV action is available without selecting any row in the table.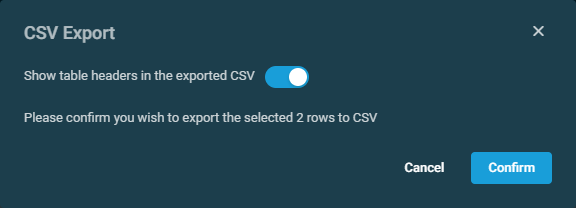 |
| Export All (Max. 500) Rows to CSV | |
| Uncheck All | Clears all selected rows. The number of selected rows is indicated next to the Row Actions icon. |
The number of results displayed can be specified by selecting the desired number from the pagination control. This selection will persist the next time the page is accessed.
NOTE The network topology map in Datto RMM is solely a visual representation of the devices that the Network Node has discovered, and it is not to be taken as a network mapping tool. Datto RMM aims at displaying the layout of the devices within the network, but, depending on the information, this may not always be possible.
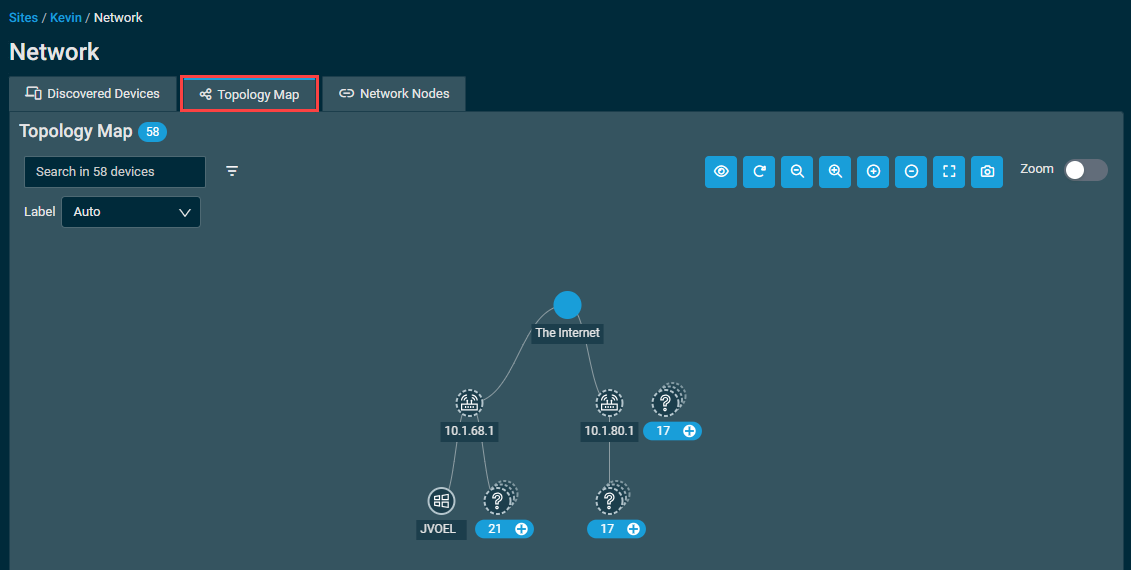
To access the network topology for a site, select the Topology Map tab at the top of the Network page.
On this tab, there are various actions you can perform:
| Field/Icon | Description |
|---|---|
Search |
Enter a hostname, IP address, MAC address, manufacturer, or NIC vendor to search for a device. The search results will be narrowed as you type and non-matching devices will appear dim within the map. If an exact match exists within a group node, that node will be automatically expanded in the map; for partial matches, the group node will be highlighted. Refer to Group nodes. |
Filter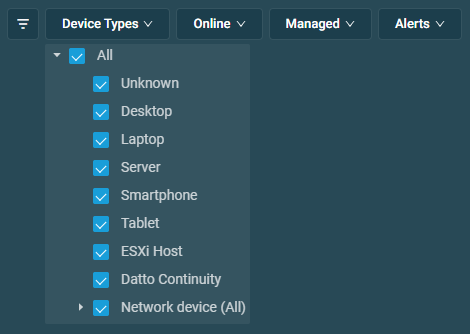 |
Click the filter icon  to view the filtering options. Select to filter on device type, online/offline status, Managed/Unmanaged status, and whether devices have open alerts. to view the filtering options. Select to filter on device type, online/offline status, Managed/Unmanaged status, and whether devices have open alerts. |
Label |
Select how to label devices in the map. |
Device Legend |
Click to view the device legend. For more information, refer to Device legend details.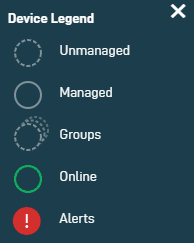 Clicking a second time or clicking X will close the legend. The legend can also be clicked and dragged around the map. |
Topology Orientation |
By default, the map is displayed in landscape mode (left to right). Click to toggle back and forth between landscape mode and portrait mode (top to bottom), depending on how you prefer to view your discovered devices. Upon switching the orientation, the default size of the map is adjusted to fit on the screen. |
Zoom Out/Zoom In |
Zoom out or in on the map. Zoom prevent you from losing sight of the map completely. |
Expand/Collapse All Nodes |
Expand or collapse all group nodes in the map. Refer to Group nodes. |
Fit to Screen |
Click to show the entire map within the page. |
Save Topology as Image |
Click to save a screenshot of the map as currently displayed within the page. |
Zoom Toggle |
Toggle to enable zooming in or out of the map using the mouse wheel instead of the zoom in/out buttons. |
Within the map, various icons represent different types of devices. 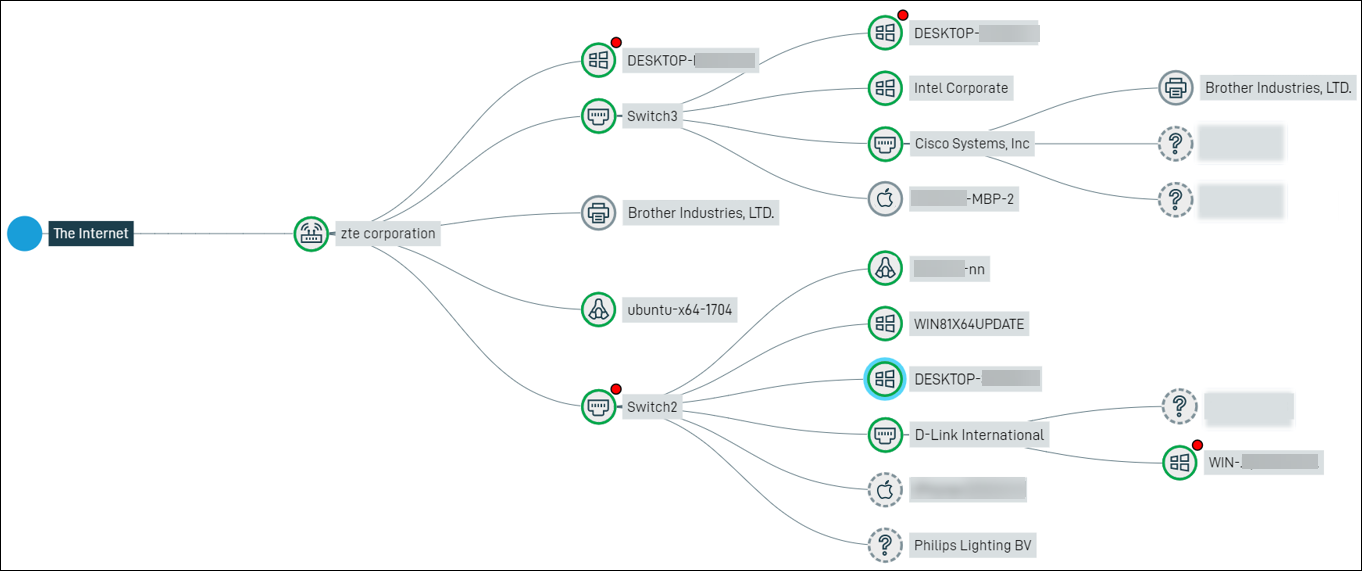
NOTE If devices with the same MAC address but different IP addresses are detected, only one device will appear on the Discovered Devices page based on the device's MAC address.
Group nodes
In addition, devices in the network topology can be grouped by similar type, network association, and management status into group nodes. A blue badge will indicate the number of devices contained within the group node. 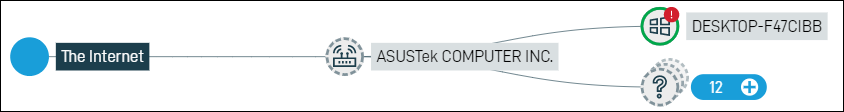
Device legend details
Visual indicators for devices within the topology map are as follows:
| Indicator | Description |
|---|---|
| Dashed circle | Indicates an Unmanaged device. |
| Solid circle | Indicates a Managed device. |
| Dashed rectangle | Indicates all the devices contained within a group (appears when hovering over the group of devices). Refer to Group nodes. |
| Solid line | Indicates the route from one device to another. |
| Green circle | Indicates the device is currently online. |
| Blue circle | Indicates the currently selected device. |
| Red exclamation mark | Indicates whether the device has one or more open alerts. It will also appear at the group node level if the device is contained within a group node. |
| Blue group node badge | Indicates a group node and the number of devices contained within. Click the plus icon to expand the group or the minus icon to collapse the group. |
Hovering over a device in the map will display additional details about the device.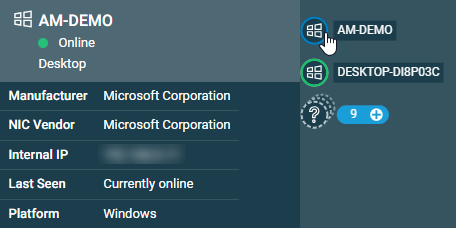
Clicking a device in the map will open a pane to the right for viewing the device details.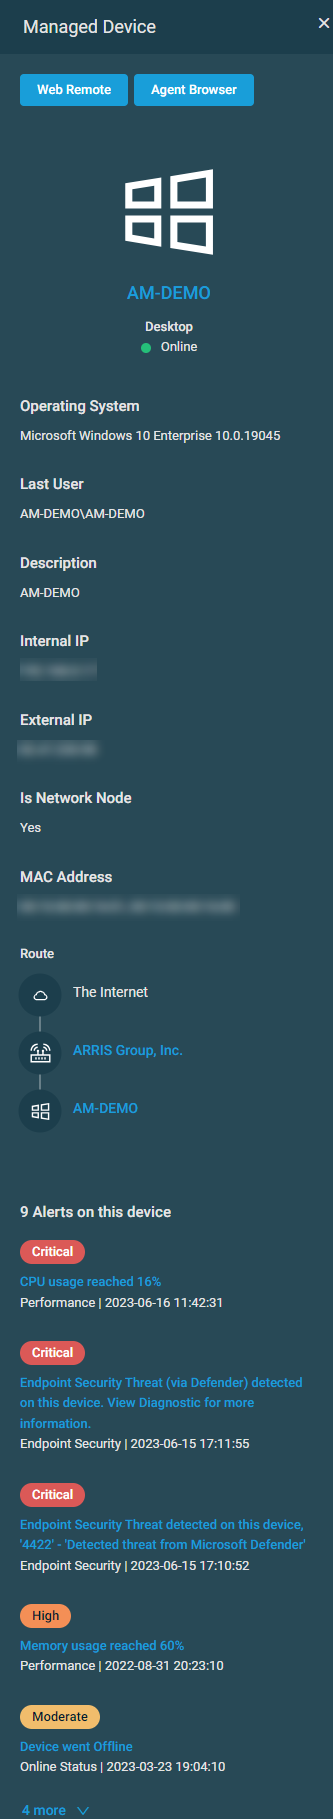
The details displayed within the pane depend on the type of device. If the device is online, you can access it remotely via a Web Remote or Agent Browser session by clicking the respective action buttons at the top of the pane. Refer to Action buttons for more information. Clicking a hyperlinked device name will open the device summary page for that device. Refer to Device summary. If the device has open alerts, clicking a hyperlinked alert name will open the Single Alert View page for that alert. Refer to Single Alert View.
For discovered devices that have not yet been onboarded to Datto RMM, clicking a device in the map will open a pane to the right for viewing the details of the Unmanaged device. From here, you may onboard the device by clicking Onboard. Refer to Onboard Devices.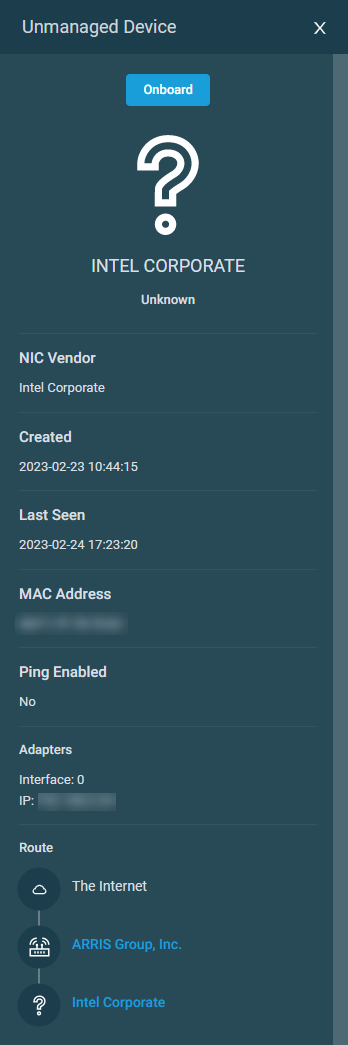
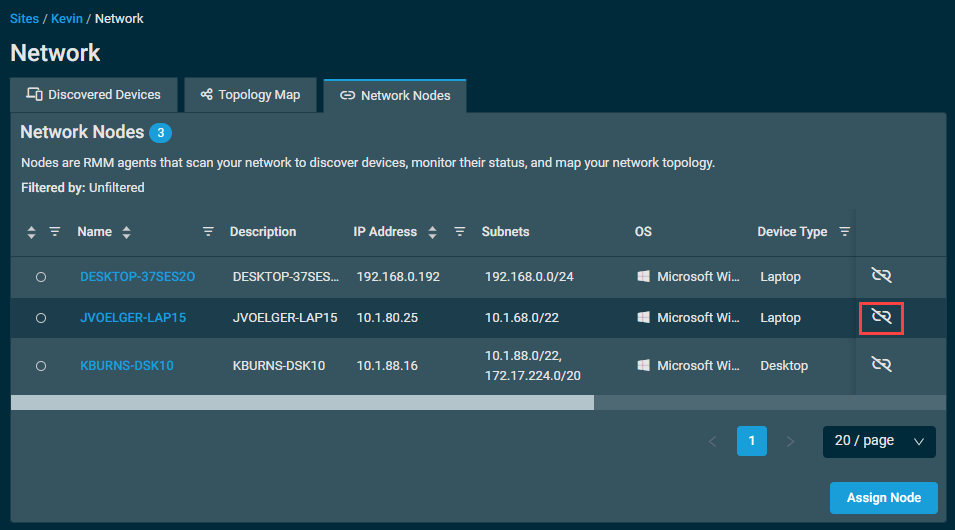
To view a site's Network Nodes and configured additional subnets, select the Network Nodes tab at the top of the Network page.
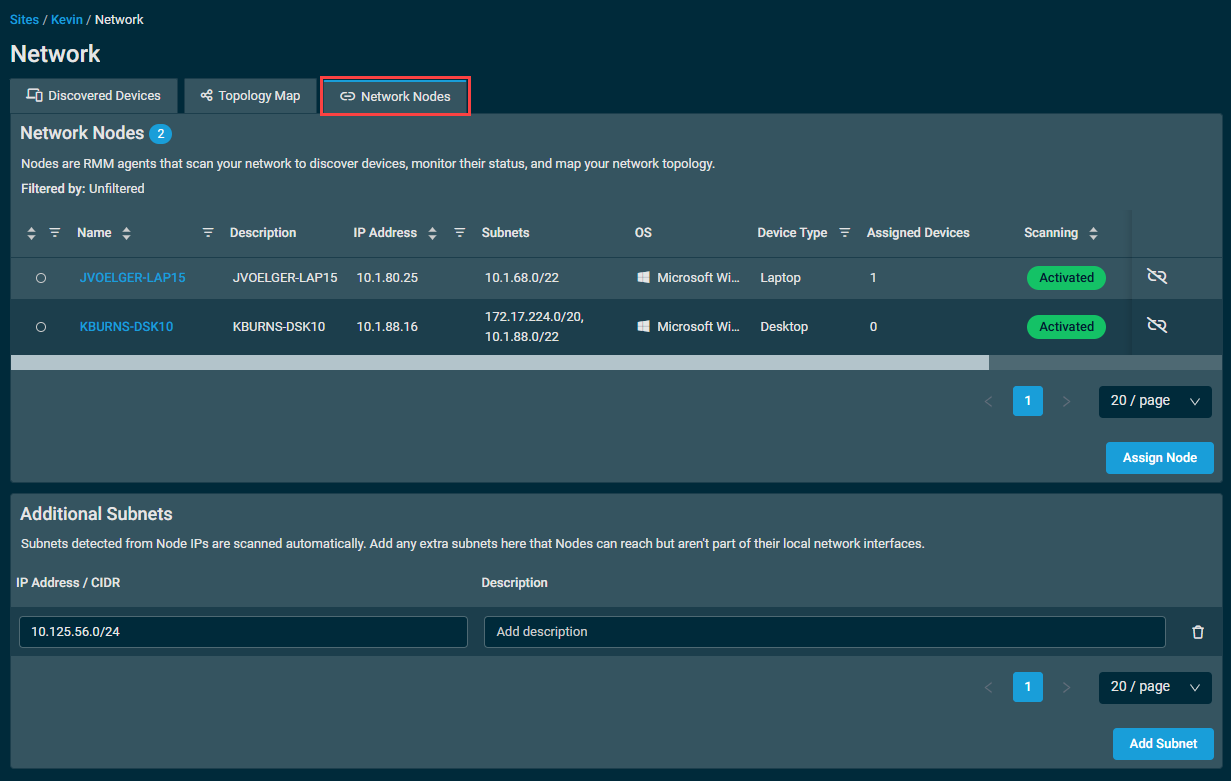
The Network Nodes section at the top of the page will show all Network Nodes for the site, and display their online and scanning status, as well as other device information. You can manage the Network Nodes for a site in the following ways:
Assign additional Network Nodes
You can assign additional Network Nodes to the site by clicking Assign Node. This will open the Assign Node window where you will be able to select one or more devices from the site to act as Network Nodes.
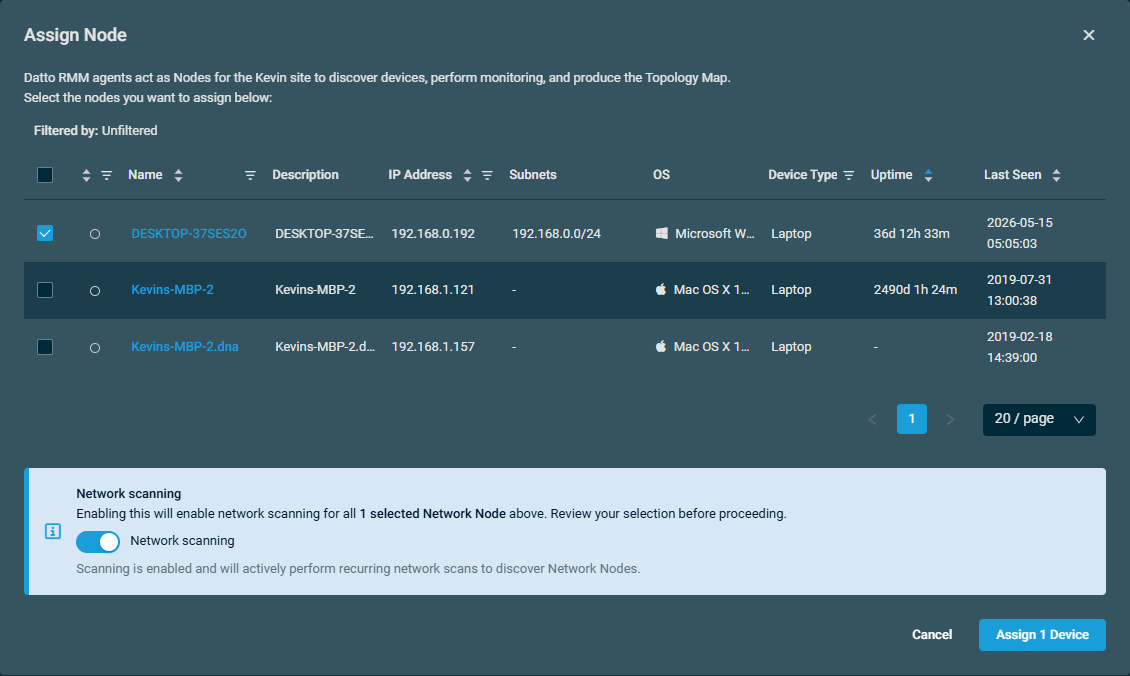
When selecting devices to add as Network Nodes, you have the option to enable network scanning for those devices by enabling the Network scanning option at the bottom of the page. Enabling network scanning will use those devices to actively perform recurring network scans to discover devices on the network.
When ready, select Assign X Device(s), where X is the number of devices you selected in the Assign Node window. This will open the Confirm & Assign window. After reviewing the configuration, click Confirm & Assign to assign the new Network Node(s).
Remove a device's assignment as a Network Node
To remove a device's assignment as a network node, click Unassign as Node ( ) for that device on the Network Nodes tab.
A pop-up window will appear confirming the subnets that the node scans, and if any devices are assigned to it, you will be prompted to select a new network node to assign those devices to.
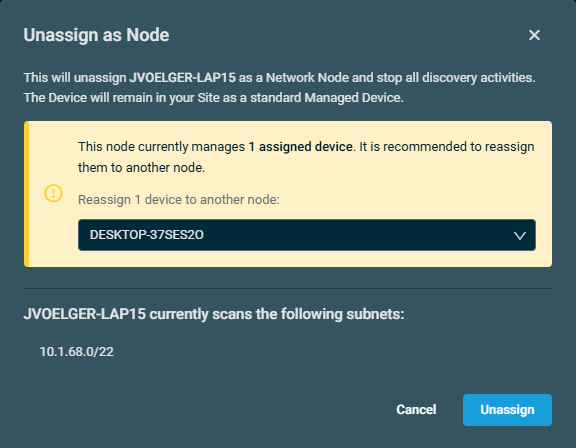
When ready, click Unassign to remove the Network Node designation from the selected device, and reassign their assigned devices if needed.
Manage additional subnets
Subnets detected via Network Nodes are scanned automatically, however you can add extra subnets here that Network Nodes can reach that aren't part of their local network interfaces.
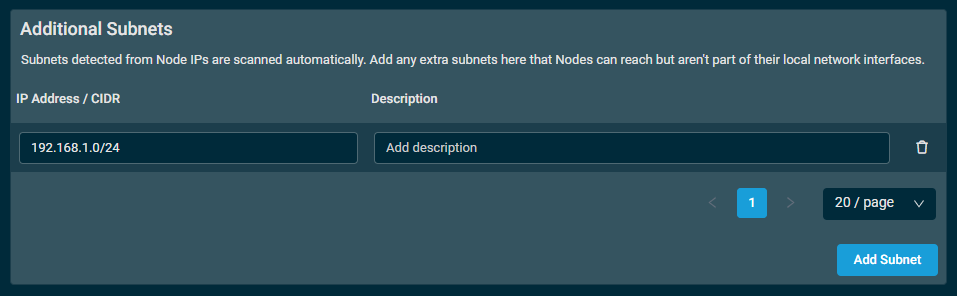
To add a new subnet, click Add Subnet. This will add a new line where you can configure the following fields for your new subnet:
- IP Address / CIDR: Enter your IP address range in CIDR notation. Refer to On CIDR notation.
- Description: Optionally, enter in a description for the subnet.
When done configuring a subnet, click away from the input fields to automatically save the configuration.
Datto RMM uses CIDR notation in place of IP ranges when denoting subnets. This style of notation is more efficient and allows for more intelligent use of space within the interface; it is also the generally accepted standard notation across the networking landscape.
In practical terms, CIDR notation provides a compact way to describe a group of IP addresses. Instead of writing a start and end IP address, the format of 1.2.3.4/XX is used, where XX is a number between 0 and 32 that indicates how many bits of the address are used for the network portion of the subnet. The lower the number, the larger the subnet; the higher the number, the smaller the subnet.
EXAMPLE 192.168.1.0/24 represents the address range 192.168.1.0 to 192.168.1.255, which is equivalent to the subnet mask 255.255.255.0.
You can use an online CIDR range calculator to convert old-style ranges into CIDR notation. One such calculator is https://www.ipaddressguide.com/cidr.
Refer to Network log files.
Under heavy load, a Network Node may drop offline and become unable to manage and monitor network devices. No one-size-fits-all solution solves this problem because many variables must be considered in each situation.
Therefore, the recommendation is to nominate a device as a Network Node, and then set up both a CPU and a Memory monitor against it. Refer to Memory monitor in Creating a monitor.
You can then proceed to add devices and monitors to the Network Node. Keep an eye on the CPU and Memory monitor metrics until the Network Node's resource use begins to breach limits. This can then be treated as a benchmark, and you can provision more Network Nodes in the same manner as necessary.
Datto RMM checks for newly added devices at 00:30 UTC, 08:30 UTC, and 16:30 UTC. If newly added devices are found during these checks, an email notification will be sent to the email addresses configured at the global and site levels. Refer to Email Recipients in Global Settings and Email Recipients in Creating or editing a site.


