Monitors
PERMISSIONS Refer to Sites > Monitor in Permissions.
NAVIGATION Policies > Monitoring > click the name of a policy > Add Monitor
NAVIGATION Policies > All > click the name of a Monitoring policy > Add Monitor
NAVIGATION Global > Policies > click the name of a Monitoring policy > Add Monitor
NAVIGATION Sites > All Sites > click the name of a site > Policies (left navigation menu) > click the name of a Monitoring policy > Add Monitor
NAVIGATION Device summary page > Monitors card > Create a Monitor. To view the various navigation paths you can use to access the device summary page, refer to Device summary.
NAVIGATION The Threat Detection monitor is available only as part of an Endpoint Security policy. Refer to Datto Endpoint Security in Endpoint Security policy.
NAVIGATION The Windows Defender Antivirus monitor is only available as part of an Endpoint Security policy. Refer to Managed Windows Defender Antivirus in Endpoint Security policy.
About monitors
Monitors can keep track of a variety of attributes, processes, settings, statuses, events, and much more. They can raise an alert when the device they are deployed to is not operating within specified parameters.
You can create and manage the following types of monitors:
- Antivirus Status monitor
- Component monitor
- CPU monitor
- Datto Continuity monitor
- Disk Usage monitor
- ESXi Data Store monitor
- ESXi Disk Health monitor
- ESXi Fan monitor
- ESXi PSU monitor
- ESXi Temperature monitor
- Event Log monitor
- File/Folder Size monitor
- Memory monitor
- Online Status monitor
- Patch monitor
- Ping monitor
- Process monitor
- Ransomware monitor
- Service monitor
- SNMP monitor
- SNMP Throughput monitor
- Software monitor
- Threat Detection monitor
- Windows Defender Antivirus monitor
- Windows Performance monitor
- WMI monitor
Creating a monitor
To create a monitor, follow any of the navigation paths described in Security and navigation.
- In the Monitor Type section, click Select.
- In the Select a Monitor pane, use the search bar to search for a monitor type or scroll down in the list. Click Select to specify the monitor type.

- Once the monitor type has been selected, you can configure the monitor criteria. To choose a different monitor type, click Change Monitor Type and modify your selection.
The Datto RMM Agent can be instructed to alert when no antivirus product is detected or it has a certain status (for example, Not running). For information on which antivirus products are detected by Datto RMM, refer to Antivirus detection.
Supported operating systems/device types in the New UI: Windows, macOS, Linux.
Configure the following criteria:
| Field | Description |
|---|---|
| Antivirus status is found to be | Select the antivirus status you want to monitor: • Not Detected • Not Running • Running And Not Up To Date |
| For a period of (minutes) | Specify for how long the device's antivirus status needs to be in this state before an alert is raised (1-240 minutes). |
| Raise an alert of priority | Choose the priority of the alert that will be raised: • Critical • High • Moderate • Low • Information |
| Auto resolve the alert if it is no longer applicable | Configure the monitor to automatically resolve the alert if it's no longer triggered after a specified time frame (1 minute - 1 week). The monitor will then be reset, allowing further alerts to be raised. |
Component monitors are scripts that regularly run on your devices and raise an alert if a specific condition is met. You can find and download a number of pre-configured component monitors from the ComStore covering antivirus packages, backup systems, CPU temperature, predicted hard drive failures, etc. Refer to Download a component. When one of these components is run on a device, it will raise an alert if an issue occurs. You can also create and add your own monitoring scripts to your Component Library if you need to be able to generate alerts based on specific requirements. To learn how to start writing and uploading these scripts to your account, refer to Creating a custom component monitor.
Supported operating systems/device types in the New UI: Windows, macOS, Linux.
Configure the following criteria:
| Field | Description |
|---|---|
| Select a Component Monitor | Click the Select a Component Monitor button to add a component from your Component Library. Use the search bar to search for a component or scroll down in the list, and click Select.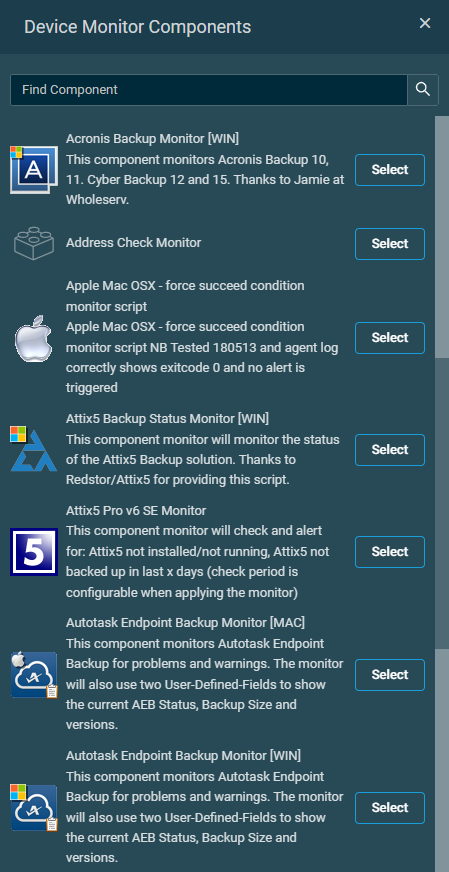 In order for a component to appear in this list, it first needs to be added to your Component Library by downloading it from the ComStore or by creating and adding your own custom component. Refer to Creating a custom component monitor. You will only be able to see components available to you based on your component level. Refer to Component Level. Once a component has been selected, you can configure any required variables. Variable value limit: 20,000 characters.  To choose a different component, click Change Component Monitor and modify your selection. |
| Execute the Component monitor every (minutes) | Specify how often the monitor should run. |
| Raise an alert of priority | Choose the priority of the alert that will be raised: • Critical • High • Moderate • Low • Information |
| Auto resolve the alert if it is no longer applicable | Configure the monitor to automatically resolve the alert if it's no longer triggered after a specified time frame (1 minute - 1 week). The monitor will then be reset, allowing further alerts to be raised. |
There may be times when your device runs noticeably slower than usual. One reason may be the device's high CPU usage. It is normal to have high CPU usage occasionally, but having it for a longer period of time might indicate hardware or software problems or may even be a sign of virus or malware infection. Monitoring your devices' CPU usage may help you proactively address further issues.
Supported operating systems/device types in the New UI: Windows, macOS, Linux, ESXi.
Configure the following criteria:
| Field | Description |
|---|---|
| CPU usage on a device has reached | Specify what the CPU usage threshold should be (1-100%). NOTE Only tracking CPU usage of 100% may not allow Datto RMM to properly alert, as the device may not be functioning properly at this level. Because of this, it is recommended that CPU monitoring is done at lower CPU usage thresholds, with a higher time threshold, in addition to 100% CPU usage. This additional early warning allows time to act before a device becomes too unstable to remotely respond to issues. |
| For a period of (minutes) | Specify for how long the device's CPU usage needs to be above the threshold before an alert is raised (1-60 minutes). |
| Check interval (minutes) | Specify the check interval (1-60 minutes). |
| Raise an alert of priority | Choose the priority of the alert that will be raised: • Critical • High • Moderate • Low • Information |
| Auto resolve the alert if it is no longer applicable | Configure the monitor to automatically resolve the alert if it's no longer triggered after a specified time frame (1 minute - 1 week). The monitor will then be reset, allowing further alerts to be raised. |
When this monitor is applied to a device that is protected by a Datto Continuity device, the Datto RMM Agent can alert you if the protected device experiences a backup failure on its Datto backup agent.
NOTE Make sure to enable the Datto Continuity Integration before configuring the monitor. Refer to Datto Continuity Integration.
Supported operating systems/device types in the New UI: devices protected by your Datto Continuity device.
Configure the following criteria:
| Field | Description |
|---|---|
| Time frame | Specify the time frame to monitor for errors (1-48 hours). |
| Raise an alert of priority | Choose the priority of the alert that will be raised: • Critical • High • Moderate • Low • Information |
NOTE This type of monitor does not automatically resolve alerts. Alerts must be resolved manually.
Low disk space on a device can result in poor performance, application problems, and eventually user complaints when they cannot save any more data. If the available space on your hard drive drops below a certain threshold, the device may not be reliable anymore; therefore, it is important to be aware of any disk space issues.
Supported operating systems/device types in the New UI: Windows.
Configure the following criteria:
| Field | Description |
|---|---|
| Drive and threshold | Select the drive you want to monitor and specify the disk space threshold that needs to be passed for an alert to be triggered (% used/GB used/ GB free). If you enter a percentage value, you can only use integers. NOTE If you select the option Any Drive and multiple drives are over the threshold, only one alert will be triggered for one of the drives. The Agent will not alert for each drive individually. NOTE Any Drive Disk Usage monitor will only show value for a drive that is closest to the threshold set within the monitor. Refer to the Monitors card on the Device summary page. NOTE If a drive letter selected for monitoring is not present on a targeted device, then no data will be returned for that monitor. |
| Only apply for disks > GB | Select the check box to only apply the monitor to disks above a certain disk capacity and enter a value of GB. This option is useful if you want to exclude disks below a certain capacity (for example, USB sticks). |
| Only apply to fixed drives | Select the check box to only apply the monitor to fixed drives. |
| For a period of (minutes) | Specify for how long the device's disk usage needs to be in this state before an alert is raised (1-60 minutes). |
| Raise an alert of priority | Choose the priority of the alert that will be raised: • Critical • High • Moderate • Low • Information |
| Auto resolve the alert if it is no longer applicable | Configure the monitor to automatically resolve the alert if it's no longer triggered after a specified time frame (1 minute - 1 week). The monitor will then be reset, allowing further alerts to be raised. |
This monitor raises an alert if the available space in any of the datastores on an ESXi host drops below a certain threshold.
Supported operating systems/device types in the New UI: ESXi.
Configure the following criteria:
| Field | Description |
|---|---|
| Usage of any datastore on an ESXi host has passed | Specify the threshold that needs to be passed for an alert to be triggered (%). You can only use integers. NOTE ESXi Data Store monitor will only show the datastore that is closest to the threshold set within the monitor. Refer to the Monitors card on the Device summary page. |
| For a period of (minutes) | Specify for how long the datastore needs to be in this state before an alert is raised (0-60 minutes). |
| Raise an alert of priority | Choose the priority of the alert that will be raised: • Critical • High • Moderate • Low • Information |
| Auto resolve the alert if it is no longer applicable | Configure the monitor to automatically resolve the alert if it's no longer triggered after a specified time frame (1 minute - 1 week). The monitor will then be reset, allowing further alerts to be raised. |
This monitor raises an alert if any disk on any targeted device registers disk health or RAID errors. The monitor relies on the presence of CIM providers. ESXi servers must have CIM providers installed to provide the information this monitor requires. Devices that do not have CIM providers installed will not raise any alerts.
NOTE No alert is raised if the status of the monitored object is Unknown.
Supported operating systems/device types in the New UI: ESXi.
Configure the following criterion:
| Field | Description |
|---|---|
| Raise an alert of priority | Choose the priority of the alert that will be raised: • Critical • High • Moderate • Low • Information |
NOTE This type of monitor does not automatically resolve alerts. Alerts must be resolved manually.
This monitor raises an alert if the status of any fan unit on any targeted device is other than Normal.
NOTE No alert is raised if the status of the monitored object is Unknown.
Supported operating systems/device types in the New UI: ESXi.
Configure the following criterion:
| Field | Description |
|---|---|
| Raise an alert of priority | Choose the priority of the alert that will be raised: • Critical • High • Moderate • Low • Information |
NOTE This type of monitor does not automatically resolve alerts. Alerts must be resolved manually.
This monitor raises an alert if the status of any power supply on any targeted device is other than Normal.
NOTE No alert is raised if the status of the monitored object is Unknown.
Supported operating systems/device types in the New UI: ESXi.
Configure the following criterion:
| Field | Description |
|---|---|
| Raise an alert of priority | Choose the priority of the alert that will be raised: • Critical • High • Moderate • Low • Information |
NOTE This type of monitor does not automatically resolve alerts. Alerts must be resolved manually.
This monitor raises an alert if the temperature sensors on the ESXi host exceed a certain threshold.
Supported operating systems/device types in the New UI: ESXi.
Configure the following criteria:
| Field | Description |
|---|---|
| Temperature sensors on host exceeds (°C) for (minutes) | Specify the temperature threshold that needs to be passed for an alert to be triggered (°C). Also specify for how long the temperature needs to be above the threshold before an alert is raised (0-60 minutes). |
| Raise an alert of priority | Choose the priority of the alert that will be raised: • Critical • High • Moderate • Low • Information |
| Auto resolve the alert if it is no longer applicable | Configure the monitor to automatically resolve the alert if it's no longer triggered after a specified time frame (1 minute - 1 week). The monitor will then be reset, allowing further alerts to be raised. |
The Windows Event Log is a rich source of information about the health and status of the devices you manage and support. A large number of operating system features as well as the applications that are running on the device will write to the event log when they encounter problems. You can see events like virus infections, backup status, or even pending hardware failures by looking at specific event log entries. The Datto RMM Agent can query the Windows Event Viewer for diagnostic information, monitor the event logs, and raise an alert whenever the entries you are interested in are created.
Supported operating systems/device types in the New UI: Windows.
Configure the following criteria:
| Field | Description |
|---|---|
| An event in | Enter an Event Log Name. This is displayed as Log Name in Windows Event Viewer (for example, Application, System, etc.). As you start typing, you will see a list of matching items to choose from. The suggestions are derived from the audit data the platform receives from all devices in your Datto RMM account, including data from deleted devices. |
| ... raised by | Enter an Event Source Name, which is the name of the software that generates the log event. This is displayed as Source in Windows Event Viewer (for example, Service Control Manager). As you start typing, you will see a list of matching items to choose from. The suggestions are derived from the audit data the platform receives from all devices in your Datto RMM account, including data from deleted devices. Results are dependent on the value selected in the preceding An event in field (that is, the event log name). If a value is not appearing in the list, it has not yet been submitted by the device. However, you can still enter the value manually. You can use the % wildcard character if you do not know the exact name or would like to search for multiple names. The wildcard character search is not case-sensitive. Entering a space before or after the wildcard character will alert for results that contain a space before or after the keyword entered, respectively. EXAMPLE Entering %service% will alert for Directory Service, Active Directory Web Services, and Time-Service. EXAMPLE Entering % service will alert for Directory Service and Active Directory Web Services but not for Time-Service. EXAMPLE Entering % directory will alert for Active Directory Web Services but not for Directory Service. EXAMPLE Entering replication % will alert for File Replication Service but not for DFS Replication. Do not use quotation marks when entering an Event Source Name. NOTE Windows operational logs have a specific syntax for Log Name and Source. To obtain the correct Log Name and Source for a specific operational log entry, run the command wevtutil qe Application-Name-Here/Operational /c:1 /f:text /rd:true on the device exhibiting a log entry you wish to search for. The output data can be used to create an Event Log monitor definition. |
| ... and matching (fill in at least one of these fields) |
Event codes
Enter one or more event codes separated by a space. For example: 1 56 431. An event code is displayed as Event ID in Windows Event Viewer. The monitor will alert if any of the event codes entered here are detected in the event log. The query operates on the basis of equals and not contains. For example, a monitor for the event code 44 will only alert for that event code and not for 440. Use a minus sign in front of an event code to exclude that event from the monitor. (For example, if you set -44 as the event code, the Agent will alert for all event codes except for 44.) Here are a few examples of important Event IDs that might be logged to your device's event log if something goes wrong: TIP You can also monitor built-in Windows backups using an Event Log monitor. |
|
Event types
NOTE If no event types are selected, then all event types raised that match the other configurations on this monitor will raise an alert. |
|
| Event descriptions
Enter one or more words, or phrases enclosed in quotation marks, of which at least one should be present in the body of the event message. The monitor will alert if the description entered here is detected in the event log. In Windows Event Viewer, you can view these messages in the Event Properties windows upon opening specific events. Use a minus sign in front of a word or phrase to indicate that it should not be present in the body of the message. EXAMPLE Entering "backup failed" -partial will alert for events with messages containing the phrase "backup failed" but not messages that also contain the word "partial." EXAMPLE Entering "database engine" -attached -stopped will alert for events with messages containing the phrase "database engine" but not messages that also contain the word "attached," contain the word "stopped," or contain both of those words. EXAMPLE Entering "Open procedure for service" -"Access is denied" will alert for events with messages containing the phrase "Open procedure for service" but not messages that also contain the phrase "Access is denied." Use a space between the event descriptions to apply an "or" condition. EXAMPLE Entering failed error will alert for events with messages containing the word "failed," containing the word "error," and containing both of those words. EXAMPLE Entering policies policy -"duplicate definition" -defined will alert for events with messages containing the word "policies," containing the word "policy," and containing both of those words but not messages that also contain the phrase "duplicate definition," contain the word "defined," or contain both that phrase and that word. Use a wildcard character to monitor for text at the start of a message, for any text contained in a message, or for text at the end of a message (that is, "starts with%", "%contains%", or "%ends with"). The wildcard character search is not case-sensitive. EXAMPLE Entering "Initiating changes for package%" will alert for events with messages starting as follows: "Initiating changes for package..." EXAMPLE Entering "%Reconfiguration success or error status: 0" will alert for events with messages ending as follows: "...Reconfiguration success or error status: 0." EXAMPLE Entering "%Office 16%" will alert for events containing "Office 16" anywhere in their messages. If an event description has text within quotation marks (for example, "Home PC") and you want to get an alert based on the information within the quotation marks, you need to add quotation marks around the quotation marks (for example, ""Home PC""). |
|
| Raised/not raised for a period of (minutes) |
Select whether you want to be alerted when an event is raised or not raised. Also specify the number of times this should occur within a certain time frame (maximum value: 5999 minutes) for the alert to be created.
NOTE The Event Log monitor timer is periodically reset to 0 minutes, including when the policy containing the monitor is deployed, upon automatic monitor recalculation, and when the Datto RMM Agent is accessed on the device. If a reset occurs before the specified number of minutes has passed, the alert will not be created within the specified time frame. NOTE The Datto RMM Agent is able to detect events logged up to 10 minutes before the Datto RMM Agent Process starts. |
| Raise an alert of priority | Choose the priority of the alert that will be raised: • Critical • High • Moderate • Low • Information |
| Auto-resolution | Select the check box to configure the auto-resolution details. If the event specified here is detected in the event log, the alert will be automatically resolved. The monitor will then be reset, allowing further alerts to be raised. See above for more information about the following: • Event Source Name • Event codes • Event types • Event descriptions • Raised/not raised for a period of (minutes) Refer to Best practices for Windows Event Log monitoring to learn more about auto-resolution use cases. |
Event log alert de-duplication
- For an Event Log monitor, a total of five alerts can be raised per device within 12 hours. When the fifth alert has been reached, the trigger count will be incremented by one on the last alert. For example, when alert #6 would be raised, the trigger count on alert #5 will display 2 in the Timeline card. The trigger count will keep rising for any subsequent alerts. To learn how to view the Timeline card in the New UI, refer to Timeline.
- If an Event Log monitor assigned to a device triggers excessively (over 100 times in 24 hours), the Global monitor alert rate limit will take effect.
At times you may find that opening certain files or folders takes too much time and your device slows down or even freezes. In these cases, it is worth checking the size of the files or folders. Keeping your system organized will help you prevent an overflow of data and may also prevent you from running out of disk space.
Supported operating systems/device types in the New UI: Windows, macOS, Linux.
Configure the following criteria:
| Field | Description |
|---|---|
| Full path to file/folder | Select whether you want to monitor a file or a folder and enter its full path. |
| Is below/over (MB) | Select whether the size of the file or folder should be below or over a certain threshold that you specify. |
| For a period of (minutes) | Specify for how long the file or folder needs to be in this state before an alert is raised (1-60 minutes). |
| Raise an alert of priority | Choose the priority of the alert that will be raised: • Critical • High • Moderate • Low • Information |
| Auto resolve the alert if it is no longer applicable | Configure the monitor to automatically resolve the alert if it's no longer triggered after a specified time frame (1 minute - 1 week). The monitor will then be reset, allowing further alerts to be raised. |
There may be times when your device gets slower than usual, it freezes or fails to start certain programs, or it even restarts while you are working on it. One reason may be the device's high memory usage. Monitoring your device's memory performance may help you proactively address further issues.
Supported operating systems/device types in the New UI: Windows, macOS, Linux, ESXi.
Configure the following criteria:
| Field | Description |
|---|---|
| Memory usage on a device has reached | Specify what the memory usage threshold should be (1-100%). |
| For a period of (minutes) | Specify for how long the device's memory usage needs to be above the threshold before an alert is raised (1-60 minutes). |
| Check interval (minutes) | Specify the check interval (1-60 minutes). |
| Raise an alert of priority | Choose the priority of the alert that will be raised: • Critical • High • Moderate • Low • Information |
| Auto resolve the alert if it is no longer applicable | Configure the monitor to automatically resolve the alert if it's no longer triggered after a specified time frame (1 minute - 1 week). The monitor will then be reset, allowing further alerts to be raised. |
A device with a Datto RMM Agent installed normally checks in with the web interface every 90 seconds. If it does not (for example, due to a power or network outage), Datto RMM will see this device as offline. This is particularly useful for servers since they should never go offline without you knowing. In the case of ESXi servers, the monitor waits for the device to come online first. If the device is already online, monitoring will start immediately. If the device is offline, the monitor will only start monitoring the device once it has come online and then gone back offline. Every Network Node device will try to contact the ESXi host to see if it responds.
Supported operating systems/device types in the New UI: Windows, macOS, Linux, network devices, printers, Datto Continuity devices, ESXi.
Configure the following criteria:
| Field | Description |
|---|---|
| Offline/online status |
Select whether you want to be alerted when the device goes offline or comes online, and specify for how long the device needs to be in either of these states before an alert is raised. Enter any integer (maximum value: 43200 minutes). NOTE Datto Continuity devices will only check in every 10 minutes. Because of this, online status monitors with a threshold of less than 10 minutes will alert if there is a single missed check-in. For this reason it is typically recommended that online status monitors targeting Datto Continuity devices are set to longer than ten minutes to avoid false positives. |
| Raise an alert of priority | Choose the priority of the alert that will be raised: • Critical • High • Moderate • Low • Information |
| Auto resolve the alert if it is no longer applicable | Configure the monitor to automatically resolve the alert if it's no longer triggered after a specified time frame (1 minute - 1 week). The monitor will then be reset, allowing further alerts to be raised. |
NOTE An Online Status monitor prioritizes monitor configurations with an alert threshold and auto-resolution time set to 15 minutes or less.
NOTE If the Datto RMM Agent Service and Datto RMM Agent Process are disconnected from the platform, offline alerts are not raised for network devices and network devices are not marked as offline. Offline alerts and offline statuses will be present for network devices only if the Network Node's Agent Service is online and does not receive a ping response from the network device.
If you are using Datto RMM's Patch Management, create a Patch monitor to get alerts on failed patch installations. This eliminates the need to manually check if patch installations have gone through.
The monitor raises an alert when the device fails to install any patches as part of a Datto RMM Patch Management policy. Refer to Patch Management policy. For example, if three out of four patches are installed during the patch window as part of the policy, an alert will be triggered since the fourth patch was not installed. Refer to Patch Management in Device summary for information about how to review affected patches.
Supported operating systems/device types in the New UI: Windows.
Configure the following criterion:
| Field | Description |
|---|---|
| Auto resolve the alert when the device's Patch Status returns to "Fully Patched" or "Approved Pending" | Select the check box to configure the monitor to automatically resolve the alert when the patch status for the device returns to Fully Patched or Approved Pending. For patch status descriptions, refer to Determining a device's patch status. The monitor will then be reset, allowing further alerts to be raised. |
Internet Control Message Protocol (ICMP), or more commonly called Ping, is a great tool to detect and analyze network problems or to check if a device is still online. The Datto RMM Agent can send regular ICMP packets outward to another device and measure latency, packet loss, and the online status of that remote device.
Supported operating systems/device types in the New UI: Windows, macOS, Linux.
Configure the following criteria:
| Field | Description |
|---|---|
| IP address/Hostname | Select whether you want to monitor the IP address or the hostname of the device and enter it accordingly. |
| Send ping packets | Select how many ping packets should be sent to the device (1-40). |
| Check interval (minutes) | Specify the check interval (1-120 minutes). |
| Alert when host unreachable for (minutes) | Select this check box to raise an alert when the device is unreachable for a certain amount of time (1-120 minutes). |
| Alert when % packets are lost | Select this check box to raise an alert when a certain percentage of ping packets are lost (5-95%). NOTE The packet loss configuration only alerts if the monitored device is reachable but experiences a degree of packet loss. If you look to alert for the host being completely unreachable, the Alert when host unreachable for (minutes) option needs to be configured. |
| Alert when average roundtrip takes longer than (milliseconds) | Select this check box to raise an alert when the average roundtrip takes longer than a certain amount of time that you specify. |
| Raise an alert of priority | Choose the priority of the alert that will be raised: • Critical • High • Moderate • Low • Information |
| Auto resolve the alert if it is no longer applicable | Configure the monitor to automatically resolve the alert if it's no longer triggered after a specified time frame (1 minute - 1 week). The monitor will then be reset, allowing further alerts to be raised. |
There may be times when you would want to prevent end users from being able to use certain programs on their devices (for example, torrent software). Too many unnecessary or unwanted processes can slow down the device, so being able to control the processes that run in the background may help you to improve overall system performance.
Supported operating systems/device types in the New UI: Windows, macOS, Linux.
Configure the following criteria:
| Field | Description |
|---|---|
| The process |
Enter the Process name. As you start typing, you will see a list of matching items to choose from. IMPORTANT If the process name contains one or more spaces (for example, Reference 4 Systemwide.exe) and the .exe filename extension is included in the entry for this field, the monitor will not function. As a general rule, we recommend entering the process name exactly as it automatically populates from the list of matching items to choose from (that is, without .exe). Also specify when an alert should be raised. Choose any of the following options: NOTE When monitoring CPU or memory, the following calculations are used based on operating system: NOTE In the Response details section, you can configure the monitor to stop the process if it triggers an alert. Refer to Process monitor only. |
| For a period of (minutes) | Specify for how long the process needs to be in this state before an alert is raised (1-60 minutes). |
| Raise an alert of priority | Choose the priority of the alert that will be raised: • Critical • High • Moderate • Low • Information |
| Auto resolve the alert if it is no longer applicable | Configure the monitor to automatically resolve the alert if it's no longer triggered after a specified time frame (1 minute - 1 week). The monitor will then be reset, allowing further alerts to be raised. |
NOTE For general information about Ransomware Detection in Datto RMM, refer to Standalone Datto RMM Ransomware Detection.
NOTE The Ransomware monitor requires a license. Refer to Add Ransomware Detection licenses.
The Datto RMM Agent can monitor for ransomware that has been detected on a device. You can also configure an automatic response to isolate the device from the network once ransomware has been detected, and you can have the Agent attempt to stop suspected ransomware processes.
Supported operating systems/device types in the New UI: Windows.
Configure the following criteria:
| Field | Description |
|---|---|
| Any local drive | An alert will be triggered if ransomware is detected in the system drive. Additionally, you can also select one of the following locations: • Any local drive: Select the check box to monitor any local drive. Network drives, removable drives, and USB mass storage devices are excluded from being monitored. • Additional paths: Enter a path to be monitored. Network drives, removable drives, and USB mass storage devices are not recommended to be added. To add another path, click the plus sign. To remove a path, click the minus sign. Make sure there is no empty row in this section before saving the monitor. NOTE In the Response details section, you can configure the monitor to isolate the device from the network if ransomware is found and attempt to stop suspected ransomware processes. Refer to Ransomware monitor only. NOTE Device isolation can be reverted by running the Revert Device Isolation [WIN] component available in the ComStore. This will revert any isolation that has occurred on a device and return its ability to contact the Internet and other devices on the network. Refer to Download a component. |
| Additional paths | |
| Exclude the following file extensions | Enter a file extension that you want to exclude. To add another file extension, click the plus sign. To remove a file extension, click the minus sign. Make sure there is no empty row in this section before saving the monitor. |
| Raise an alert of priority | Choose the priority of the alert that will be raised: • Critical • High • Moderate • Low • Information |
NOTE The Ransomware monitor will raise an alert as soon as the Agent detects ransomware on a device. This is to notify the platform of ransomware; however, the alert will not contain diagnostic information. The monitor will then raise another alert with diagnostic information, and the Agent will resolve the first alert. You will see only one alert with diagnostic information. Refer to the Timeline card in Single Alert View.
In some scenarios, it is possible that only one alert is raised (either with or without diagnostic information).
NOTE If multiple Ransomware monitors are configured for a device and ransomware is detected, each monitor will raise an alert. However, diagnostic actions, such as collecting log files, stopping processes, isolating the device from the network, or running a response component, will only be performed once against the initial monitor. This means that only the initial monitor will contain text in the diagnostic information section of the alert Timeline card.
When the diagnostic actions have been performed, the monitor can be reset by restarting the Agent, updating the monitor configuration, or resolving the alert.
NOTE This type of monitor does not automatically resolve alerts. Alerts must be resolved manually.
Services are applications that operate in the background on your device, and while some of them are useful and necessary for the optimal running of a device, you may not need others. To ensure that critical services such as Windows Server Update Services (WSUS) or Exchange are running on your device, the Datto RMM Agent can be instructed to monitor these services.
Supported operating systems/device types in the New UI: Windows.
Configure the following criteria:
| Field | Description |
|---|---|
| The service | Enter the Service name. As you start typing, you will see a list of matching items to choose from. Also specify when an alert should be raised. Choose any of the following options: • The service is Running or Stopped. • The service has reached a certain CPU or Memory usage (0-100%). NOTE In the Response details section, you can configure options specific to Service monitor. Refer to Service monitor only. |
| For a period of (minutes) | Specify for how long the service needs to be in this state before an alert is raised (1-60 minutes). |
| After the machine has booted | Specify the startup delay (immediately - 60 minutes). |
| Raise an alert of priority | Choose the priority of the alert that will be raised: • Critical • High • Moderate • Low • Information |
| Auto resolve the alert if it is no longer applicable | Configure the monitor to automatically resolve the alert if it's no longer triggered after a specified time frame (1 minute - 1 week). The monitor will then be reset, allowing further alerts to be raised. |
An SNMP monitor allows you to monitor SNMP value changes on any Managed device (both network devices and devices with an Agent installed). The SNMP checks are done by an assigned Network Node, and an alert is generated when the SNMP alert conditions are met.
NOTE Datto RMM only supports SNMP polling. SNMP traps are not supported.
Supported operating systems/device types in the New UI: Windows, macOS, Linux, network devices, printers.
NOTE This guide assumes that you know the SNMP Object Identifiers (OIDs) that you want to monitor and the thresholds (values) that you want to monitor for. For some general information on SNMP terminology, refer to SNMP background information and terminology.
Configure the following criteria:
| Field | Description |
|---|---|
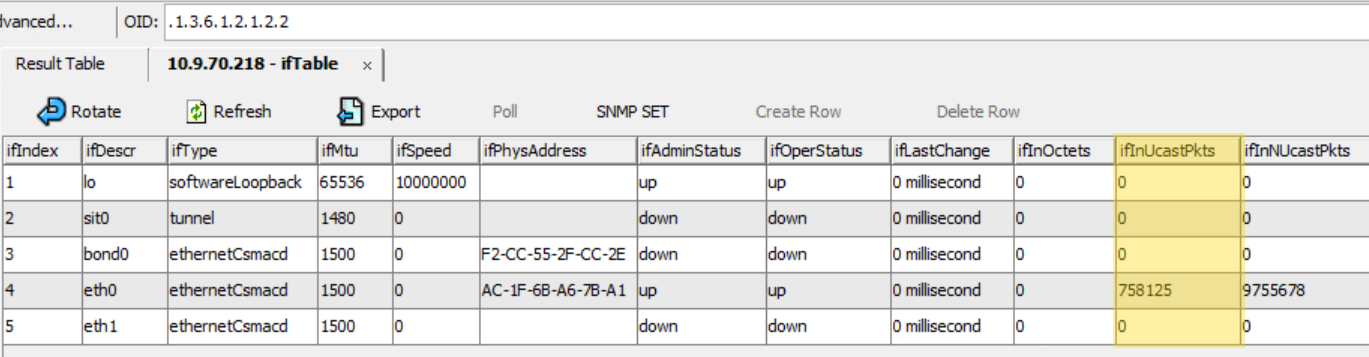
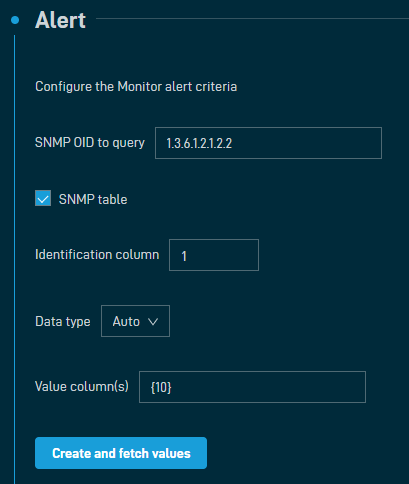
| SNMP OID to query | Specify the SNMP OID that you want to monitor. For example: 1.3.6.1.2.1.2.2. |
| SNMP table | Select this check box to monitor multiple tabular OID instances from a single monitor definition so that you don't have to manually create separate monitors for every potential OID (for example, for disks in an array). Each detected object instance will have an individual monitor applied that supports real-time monitoring data. Each monitored instance will have its own alert status and treat any tickets raised in Autotask or ConnectWise PSA as separate entities if you have either of the integrations enabled. |
| Identification column | This field is only editable when the SNMP table check box is selected. Enter the number of the table column that should be used to identify the instance. EXAMPLE In this example, the table is zero indexed so the identification column would be column 1 (highlighted). NOTE Not all tables are zero indexed; therefore, be mindful of your particular table index as configuration can be unique to your table. |
| Data type | Select one of the following options: • Auto (selected by default) • Integer • String • Timeticks The monitor will try to convert the value it gets from querying the OID to the selected data type. It will then use the converted data to evaluate thresholds and format results. If the value cannot be converted successfully, it will be returned as Null. |
| Value column(s) | This field is only editable when the SNMP table check box is selected. Enter the number of the table column that should be monitored. Use curly brackets around the column number. For example: {10}. EXAMPLE In this example, the table is zero indexed so the value column would be column 10 (highlighted). NOTE Not all tables are zero indexed; therefore, be mindful of your particular table index as configuration can be unique to your table. EXAMPLE Using the examples above, the monitor configuration would look like this: In the Value column(s) field, it is possible to specify more than one column for simple numeric calculations where operators are evaluated sequentially. EXAMPLE If table column 10 contains disk size in kilobytes (524288000) and table column 11 contains disk used in kilobytes (262144000), you can calculate the disk free space in gigabytes by entering the following calculation: {10}-{11}/1048576 (which would be 524288000 - 262144000 / 1048576 = 250). If you select GB in the Format Data as drop-down list further down, the output will be displayed as 250 GB. |
| Create and Fetch Values | This button is available with or without the SNMP table check box selected. However, it is only displayed when configuring an SNMP monitor at the device level. It is not available when configuring a monitoring policy. Click the button and then click Confirm to poll and return the current values for validation purposes. A hundred-second countdown will start as soon as you click Confirm. If any of the instances are in an alerting state, the value will be displayed in red. NOTE Only the first 25 instances will be retrieved for validation purposes. NOTE It is recommended to test the configuration at the device level before replicating the configuration in a policy. |
| Alert when SNMP result is | Select any of the following qualifiers: • equal to • not equal to • less than • less than or equal to • greater than • greater than or equal to • contains • starts with • ends with • changed Enter a value next to the selected qualifier. |
| For a period of (minutes) | Specify for how long the device needs to be in this state before an alert is raised (1-60 minutes). |
| Alert when OID is not responding | Select this check box to have the monitor raise an alert when no response is returned for an OID that has previously returned a response. This will not alert if the OID is not valid or has never responded. |
| Alert when OID is Null/NoSuchInstance/NoSuchObject | Select this check box to have the monitor raise an alert when Null, NoSuchObject, or NoSuchInstance is returned as a response. If the check box is not selected, these responses will be excluded from generating an alert. |
| Check interval (minutes) | Specify the check interval (5-120 minutes). NOTE An SNMP monitor does not run immediately upon creation. The first run will occur at a randomly generated time between 10 seconds after creation and the defined check interval. For example, if an SNMP monitor's check interval is set to 60 seconds and the Agent selects 22 seconds as the random time between 10 seconds and the check interval, the monitor's first run will be 22 seconds after creation. The second run will be at 82 seconds as any subsequent check will occur every 60 seconds. |
| Result calculation (numeric values) | Select this check box to be able to perform a calculation on the result. Once the check box is selected, you can enter a mathematical operator (+ - * /) and any integer. For example, enter *4 to multiply the result by 4. Result calculations are not used to raise alerts. Alerts are raised from the original values. |
| Result translation (text values) | Select this check box to be able to configure a key to translate the output into a more easily understood string. Once the check box is selected, you can enter a key. For example: 1=OK,2=Bad. Result translations are not used to raise alerts. Alerts are raised from the original values. NOTE Result translation can only be used to convert numerical responses to text strings. A text string cannot be translated to read a different text string. |
| Display name | Enter a display name. It will appear in the description of the monitor in the Monitors card on the device summary page. Refer to Monitors in Device summary. NOTE If the Display name is blank when clicking the Create and Fetch Values button, it will be populated with the SNMP OID to query to prevent an invalid configuration. |
| Format Data as | Specify how to format the data. Select any of the following formats: • % • GB • MB • KB • bytes • days • hours • minutes • seconds • ms • ticks • C • F The selected format will be appended to the end of the data returned by the monitor. |
| Raise an alert of priority | Choose the priority of the alert that will be raised: • Critical • High • Moderate • Low • Information |
| Auto resolve the alert if it is no longer applicable | Configure the monitor to automatically resolve the alert if it's no longer triggered after a specified time frame (1 minute - 1 week). The monitor will then be reset, allowing further alerts to be raised. |

This monitor allows you to see whether your network hardware is overworked or if your networks could support more strenuous action. It monitors the bandwidth consumption of the network devices' internal or external interfaces using the OIDs in the IF-MIB. This monitor is useful to detect periods of increased network load.
Supported operating systems/device types in the New UI: network devices, printers.
Configure the following criteria:
| Field | Description |
|---|---|
| Interface number | Enter an interface number (maximum value: 3 digits). |
| Check interval (minutes) | Specify the check interval (5-120 minutes). |
| Check interface usage | Select the interface usage you want to monitor: • incoming • outgoing • total |
| Alert when the average value of the last check(s) is (Mbps) | Specify the number of checks (1-10) and select any of the following qualifiers: • equal to • not equal to • less than • less than or equal to • greater than • greater than or equal to Enter a value next to the selected qualifier (Mbps). |
| Raise an alert of priority | Choose the priority of the alert that will be raised: • Critical • High • Moderate • Low • Information |
| Auto resolve the alert if it is no longer applicable | Configure the monitor to automatically resolve the alert if it's no longer triggered after a specified time frame (1 minute - 1 week). The monitor will then be reset, allowing further alerts to be raised. |
The Datto RMM Agent can monitor whether a certain software application has been installed or uninstalled on your endpoints, or if it has changed version.
Supported operating systems/device types in the New UI: Windows.
Configure the following criteria:
| Field | Description |
|---|---|
| After a software package matching | Enter the name of the software application you want to monitor. As you start typing, you will see a list of matching items to choose from. Use quotation marks for phrase match. You can also use the % wildcard character if you do not know the exact name or would like to search for multiple software applications. NOTE If using a wildcard to search for multiple software applications, if the software does not have a name listed in the registry at the time the alert is triggered, the software's name will be absent from the alert. Also specify when an alert should be raised. Choose any of the following options: • The software application is installed. • The software application changes version. • The software application is uninstalled. |
| Raise an alert of priority | Choose the priority of the alert that will be raised: • Critical • High • Moderate • Low • Information |
NOTE A Software monitor cannot alert on missing software but the following ComStore components can: Monitor if Application is not installed and Software Detection Monitor. To learn how to download a component from the ComStore and how to use it, refer to ComStore and Component Library.
NOTE This type of monitor does not automatically resolve alerts. Alerts must be resolved manually.
NOTE The Threat Detection monitor is available only as part of an Endpoint Security policy. Refer to Datto Endpoint Security in Endpoint Security policy.
You can monitor for threat detection rules. If indicators of compromise are detected, the monitor will raise an Endpoint Security alert, and the alert message will contain the following text: Endpoint Security Threat detected on this device.
Supported operating systems/device types in the New UI: Windows, macOS, Linux.
Configure the following criterion:
| Field | Description |
|---|---|
| Raise an alert of priority | Choose the priority of the alert that will be raised: • Critical • High • Moderate • Low • Information |
NOTE This type of monitor does not automatically resolve alerts. Alerts must be resolved manually.
NOTE The Windows Defender Antivirus monitor is only available as part of an Endpoint Security policy. Refer to Managed Windows Defender Antivirus in Endpoint Security policy.
NOTE The Windows Defender Antivirus monitor is only supported on Windows 8.1 and above. On lower Windows versions, the Datto RMM Agent will not enforce any settings defined in the Endpoint Security policy and it will report back blank data.
You can monitor for active threats on a device and apply default remediation rules. These checks ensure that Windows Defender is able to respond to threats automatically, and that these actions can be reported on within Datto RMM. If an issue is found, the monitor will raise an Endpoint Security alert, and the alert message will contain the following text: Endpoint Security Threat (via Defender) detected on this device.
NOTE Tamper Protection is not monitored as part of the Windows Defender Antivirus monitor in Datto RMM; however, you can use the Windows Defender Tamper Protection Monitor [WIN] component from the ComStore to alert if Tamper Protection is disabled. Refer to Download a component.
Tamper Protection can also be monitored in Datto EDR. To learn about Microsoft Defender Antivirus with Datto EDR, refer to Using Microsoft Defender Antivirus with Datto EDR in the Datto EDR Help system.
Supported operating systems/device types in the New UI: Windows.
Configure the following criteria:
| Field | Description |
|---|---|
| Raise an alert of priority | Choose the priority of the alert that will be raised: • Critical • High • Moderate • Low • Information |
| Auto resolve the alert if it is no longer applicable | Configure the monitor to automatically resolve the alert if it's no longer triggered after a specified time frame (1 minute - 1 week). The monitor will then be reset, allowing further alerts to be raised. |
This monitor allows you to generate alerts for any Windows Performance Counter, such as SQL Server cache hit ratio, Exchange email queues, or a system’s Disk Queue Length.
Supported operating systems/device types in the New UI: Windows.
Configure the following criteria:
| Field | Description |
|---|---|
| Counter | Specify a counter in the form of \Category\Counter. For example: \Print Queue\Jobs. |
| Instance | Specify an object type. For example: HP LaserJet Professional. |
| Alert when performance result is | Select any of the following qualifiers: • equal to • not equal to • less than • less than or equal to • greater than • greater than or equal to Enter a value next to the selected qualifier. |
| For a period of (minutes) | Specify for how long the device needs to be in this state before an alert is raised (1-60 minutes). |
| Raise an alert of priority | Choose the priority of the alert that will be raised: • Critical • High • Moderate • Low • Information |
| Auto resolve the alert if it is no longer applicable | Configure the monitor to automatically resolve the alert if it's no longer triggered after a specified time frame (1 minute - 1 week). The monitor will then be reset, allowing further alerts to be raised. |
Windows Management Instrumentation (WMI) provides access to a lot of useful metrics on any Windows system. This monitor allows you to check specific WMI information on your devices.
Supported operating systems/device types in the New UI: Windows.
NOTE To use a WMI monitor on Windows Servers, they need to be able to get monitors on custom WMI values.
Configure the following criteria:
| Field | Description |
|---|---|
| WMI namespace | Specify the WMI namespace. |
| WMI query | Specify the WMI query. |
| WMI property | Specify the WMI property. |
| Result calculation (numeric values) | Select this check box to be able to perform a calculation on the result. Once the check box is selected, you can enter a mathematical operator (+ - * /) and any integer. For example, enter *4 to multiply the result by 4. Result calculations are not used to raise alerts. Alerts are raised from the original values. |
| Result translation (text values) | Select this check box to be able to configure a key to translate the output into a more easily understood string. Once the check box is selected, you can enter a key. For example: 1=OK,2=Bad. Result translations are not used to raise alerts. Alerts are raised from the original values. NOTE Result translation can only be used to convert numerical responses to text strings. A text string cannot be translated to read a different text string. |
| Display name | Enter a display name. It will appear in the description of the monitor in the Monitors card on the device summary page. Refer to Monitors in Device summary. |
| Format Data as | Specify how to format the data. Select any of the following formats: • % • GB • MB • KB • bytes • days • hours • minutes • seconds • ms • ticks • C • F The selected format will be appended to the end of the data returned by the monitor. |
| Alert when WMI calculated result is | Select any of the following qualifiers: • equal to • not equal to • less than • less than or equal to • greater than • greater than or equal to • contains • starts with • ends with Enter a value next to the selected qualifier. |
| Alert when no results | Select this check box to have the monitor raise an alert when no result is returned. |
| Check interval (minutes) | Specify the check interval (5-120 minutes). |
| Raise an alert of priority | Choose the priority of the alert that will be raised: • Critical • High • Moderate • Low • Information |
| Auto resolve the alert if it is no longer applicable | Configure the monitor to automatically resolve the alert if it's no longer triggered after a specified time frame (1 minute - 1 week). The monitor will then be reset, allowing further alerts to be raised. |
EXAMPLE You can try out the below configuration to monitor the health of your laptop's battery.
Configure the monitor the following way:
- WMI namespace: root\CIMV2
- WMI query: SELECT * FROM Win32_Battery
- WMI property: Status
- Display name: Battery Status
- Alert when WMI calculated result: not equal to OK
The configuration should look like this: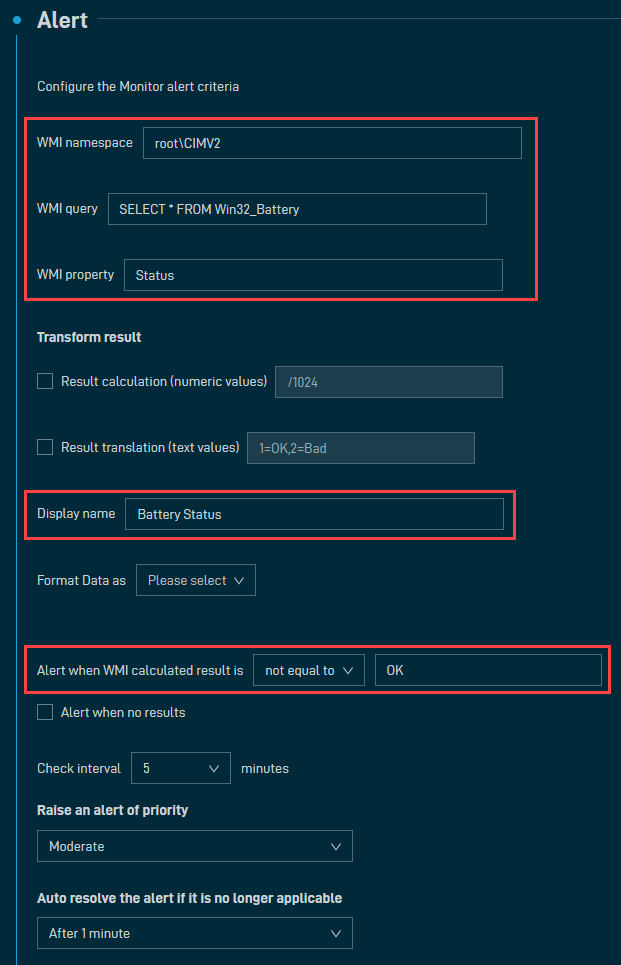
The monitoring status may look like this:
Configure a system response when a monitor alert is triggered by enabling any of the following options: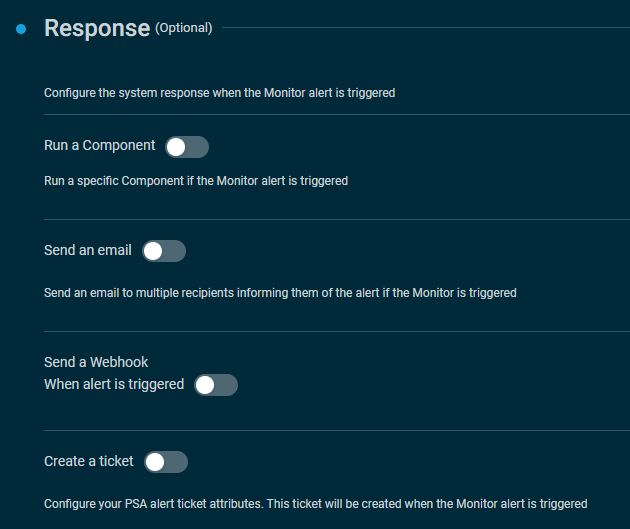
NOTE This option is only available for the Process monitor, and you can only select it if you chose "The process is Running or Stopped" option in the Process monitor's alert details. Refer to The process.
Attempt to kill the process if it triggers an alert: Select this check box to stop the process if it triggers an alert as per the criteria you specified in the monitor's alert details.
NOTE These options are only available for the Ransomware monitor.
- Isolate the device from the network: Selected by default. When selected, the device will be isolated from the network when ransomware is detected on the device. Note that the device will still be able to connect to Datto RMM and you will be able to connect to it using Web Remote.
NOTE When this option is selected, the Run a component option will become unavailable and any response component you have configured previously will be removed from the monitor.
NOTE The PowerShell script performing the device isolation is digitally signed and run using the AllSigned execution policy.
NOTE Device isolation can be reverted by running the Revert Device Isolation [WIN] component available in the ComStore. This will revert any isolation that has occurred on a device and return its ability to contact the Internet and other devices on the network. Refer to Download a component.
- Attempt to kill suspected ransomware processes: Selected by default. When selected, suspected ransomware processes will be stopped when ransomware is detected on the device.
NOTE These options are only available for the Service monitor, and you can only select them if you chose "The service is Running or Stopped" option in the Service monitor's alert details. Refer to The service.
Select any of the following options:
- Attempt to take remedial action (start a stopped service or stop a running service): Select this check box to start or stop the service if it triggers an alert as per the criteria you specified in the monitor's alert details.
- Do not alert service stopped messages if the service has been disabled: Select this check box if you would not like to be alerted if the service has been disabled.
IMPORTANT This option is not available for ESXi devices.
NOTE While the option is available during configuration, response components do not function for Online Status and Patch monitors.
Enable this option to run a specific component when the monitor raises an alert.
Once this option is turned on, you can add a component from your Component Library. You can filter components by category and component group using the filter icon  , you can use the search bar to search for a component, or you can simply scroll down in the list, and then click Select.
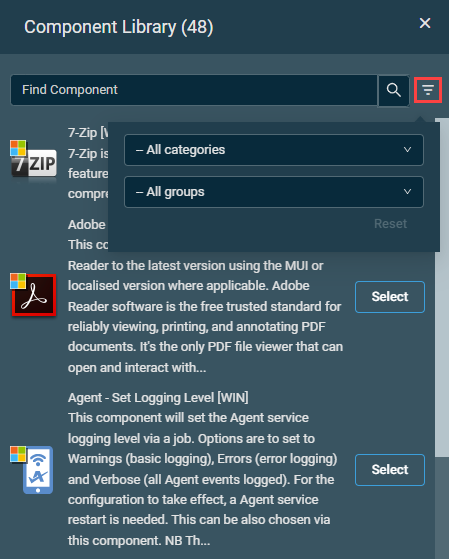
The list includes all components of the categories Applications and Scripts. Refer to Component categories. You will only be able to see the components available to you based on your component level. Refer to Component Level. For information about component groups, refer to Add to Group in Component Library.
Once a component has been selected, you can configure any required variables.
Variable value limit: 20,000 characters.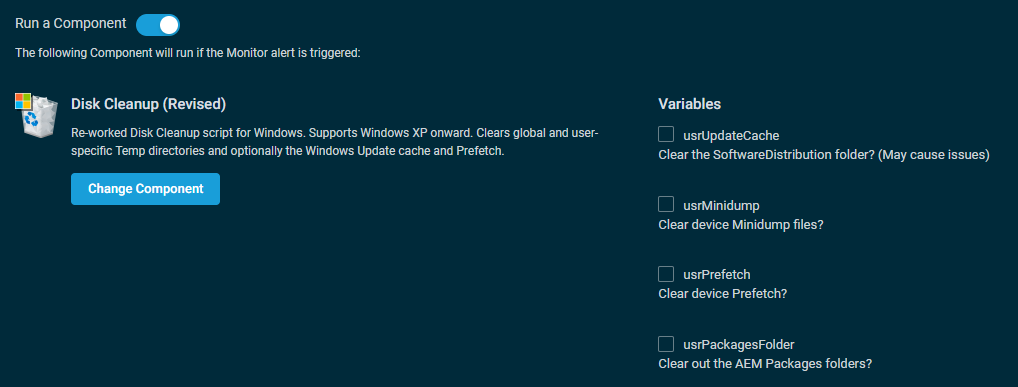
To choose a different component, click Change Component and modify your selection.
A few notes to consider
-
A response component will only fire if there is not an alert already open.
- When a component is run as a response component, its timeout setting is used. The default setting is for the response component to time out after a maximum of 60 minutes. You may wish to enter a much shorter timeout value (for example, 30 seconds) if running a simple script. Refer to Script in Creating a component.
-
Gui.exe will not run if started in Session 0 by a custom component script that attempts to start this process in response to an alert.
- For a Ransomware monitor, the Run a component option will become unavailable and any response component you have configured previously will be removed from the monitor if the Isolate the device from the network check box is selected. Refer to Ransomware monitor only. Moreover, a component run in response to a ransomware alert will time out after a maximum of 60 seconds.
-
It is recommended to wait for the executed process result in the script and proceed accordingly rather than relying on a timeout to terminate all processes in whatever state they are in. You can use the spawned process result to write/log meaningful steps for script debugging when deployed.
Enable this option to send an email to multiple recipients to inform them when the monitor raises an alert.
| Field | Description |
|---|---|
| Subject line |
Leave this field blank for a standard (automated) subject line or enter a custom subject line. You can include any of the following variables: • [hostname]: The hostname of the device. • [description]: The description of the device. • [os]: The operating system of the device. • [user-defined1-300]: User-defined field number. Refer to User-defined fields. • [lastuser]: The login name of the user that last logged in to the device. • [sitename]: The name of the site in which the device resides. • [category]: The category of the alert raised (for example, performance or event log). • [type]: The type of the alert raised (for example, memory or disk usage). • [alert]: The trigger details of the monitor that raised the alert. • [ipaddress]: The external IP address (public IP address) of the device. • [alertuid]: The alert ID. NOTE The Ticket Title field in Autotask has a limit of 255 characters. If your subject line exceeds this limit, it will be truncated in the ticket's Ticket Title field at 255 characters. NOTE The Ticket Summary field in ConnectWise PSA has a limit of 100 characters. If your subject line exceeds this limit, it will be truncated in the ticket's Ticket Summary field at 100 characters. |
| Send email to | Select the check box Add default recipients to add the account's default email recipients to the Recipients section below. To update the default recipients, refer to the Email Recipients section in Global Settings and the Email Recipients section in Creating or editing a site. |
| Recipients | Click Add Additional Recipient to add another email recipient. Enter a name, an email address, and choose the correct email type (HTML, text, or both). To remove a recipient, click the minus sign. To add another recipient, click the plus sign. Make sure there is no empty row in this section before saving the monitor. NOTE The email address field only accepts the following characters: a-z, A-Z, 0-9, @, and !#$%&'`*+-|/=?^_{}~. |
Refer to Webhooks.
Enable this option to create a ticket in a PSA tool that your RMM account is integrated with when the monitor raises an alert.
NOTE Tickets are entirely separate from alerts. If you would like to use monitors to raise tickets in an integrated PSA tool, make sure to enable this option. Alerts alone will not be able to synchronize with the PSA tool.
Autotask
NOTE You must have the Autotask Integration enabled for this option to be available. Refer to Autotask Integration.
| Field | Description |
|---|---|
| Subject line | Select the check box to use the subject line configured in the Send an email section as the ticket title. (The subject line field below will appear grayed out.) Otherwise, leave the check box clear and add a subject line to customize the ticket title, or leave the subject line blank to apply a standard (automated) subject line as the ticket title. NOTE The Ticket Title field in Autotask has a limit of 255 characters. If your subject line exceeds this limit, it will be truncated in the ticket's Ticket Title field at 255 characters. |
| Ticket details | Select the check box Use default to use the default settings of the monitor type as configured in the Autotask Integration. Refer to Configure ticket settings. (The subject line field below will appear grayed out.) If you don't want to use the default settings, leave the check box clear and select the required Source, Queue, Issue Type, Sub-Issue Type, and Work Type from the drop-down lists. The drop-down lists display the values that are currently active in Autotask. NOTE If the mapped device (that is, the Autotask configuration item) has a contact assigned in Autotask, that contact will be selected for the ticket by default. |
NOTE By default, tickets created from alerts are not assigned to any resource in Autotask.
NOTE Tickets will be assigned the AEM Alert ticket category in Autotask whether they are automatically generated by a monitor that was configured to create tickets or manually created from an alert raised by a monitor that was not configured to create tickets.
NOTE If a monitor is configured to create a ticket when an alert is raised but the device cannot get synchronized to Autotask (for example, the contract or contact of the Autotask configuration item is inactive, the device sync is switched off, and so forth), Datto RMM will queue the device sync event and will attempt to create a ticket three times (every time a device sync is triggered, approximately once every minute). If the device fails to synchronize within this time frame, a ticket will still be created for the corresponding Autotask organization containing the device name and ID and a link to the device in Datto RMM. In case the Datto RMM site is no longer mapped to an Autotask organization, a ticket will be created for the zero account.
NOTE If the ticket creation fails (for example, because of changes made to credentials, queues, categories, security settings, and so forth), a notification email will be sent to the email addresses set to receive alerts. If no email address listed under Setup > Global Settings > Email Recipients has Alerts selected, then the failed ticket email will default to the email address configured under Setup > Account Settings > Account email. Refer to Email Recipients in Global Settings. The notification email will specify the error message and the reason for the error.
ConnectWise PSA
NOTE You must have the ConnectWise PSA Integration enabled for this option to be available. Refer to ConnectWise PSA Integration.
| Field | Description |
|---|---|
| Subject line |
Select the check box to use the subject line configured in the Send an email section as the ticket title. (The subject line field below will appear grayed out.) You can include any of the following variables:
NOTE The Ticket Summary field in ConnectWise PSA has a limit of 100 characters. If your subject line exceeds this limit, it will be truncated in the ticket's Ticket Summary field at 100 characters. |
| Ticket details | Select the check box Use default to use the default settings of the monitor type as configured in the ConnectWise PSA Integration. Refer to Map Datto RMM alerts to ConnectWise PSA tickets. (The subject line field below will appear grayed out.) If you don't want to use the default settings, clear the check box and select a Service Board (required), Type, Subtype, Open Status, and Closed Status from the drop-down lists. NOTE In order to select a Subtype, a Type must first be selected. |
Once you have configured the monitor details, click Add Monitor. Click Confirm to execute the action or Cancel to close out of the dialog box. Once the monitor has been created, you will be redirected to the device summary page.
Viewing and managing monitors
The monitor detail pane opens on the right side of the page and displays all details of the selected monitor.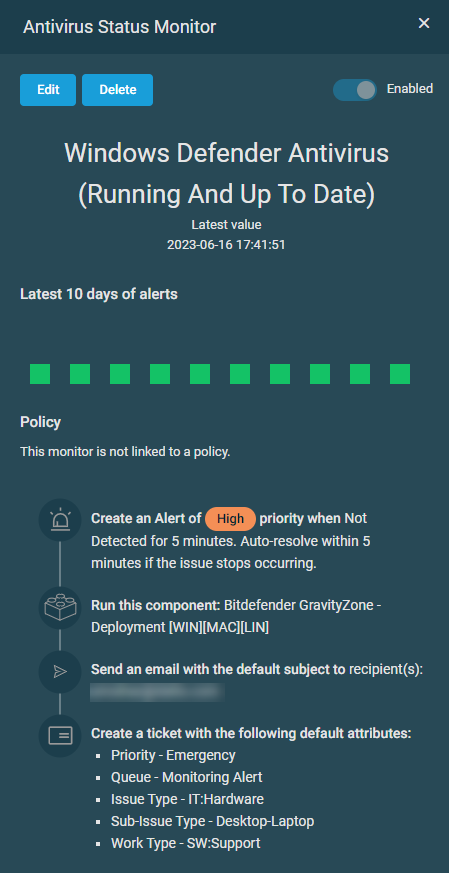
Open the monitor detail pane in one of the following ways:
- On the device summary page, navigate to the Monitors card and click the description of a monitor. Refer to Monitors in Device summary.
- In a list of alerts, click a link in the Monitor Type column. Refer to List of alerts.
- In the Overview card on the Single Alert View page, click the link in the Monitor Type field. Refer to Overview in Single Alert View.
NOTE The Threat Detection monitor is available only as part of an Endpoint Security policy. Refer to Datto Endpoint Security in Endpoint Security policy.
NOTE The Windows Defender Antivirus monitor is only available as part of an Endpoint Security policy. Refer to Managed Windows Defender Antivirus in Endpoint Security policy.
| Field | Description |
|---|---|
| Monitor type | Refer to Monitor types. |
| Edit | Only available for standalone monitors. Click Edit to update the monitor details. Refer to Editing a monitor. |
| Delete | Only available for standalone monitors. The monitor will be deleted as soon as you click the Delete button. SNMP monitors: if a monitor has an instance, this action will delete the parent monitor. |
| Enabled | Refer to Enable. |
| Latest value and last reading | Refer to Latest Value. |
| Latest 10 days of alerts | Refer to Latest 10 Days of Alerts. |
| Policy | If the monitor is part of a policy, you can click the policy name to see and update the policy details. Refer to Policies. |
| Alert details | Refer to Alert details per monitor type. |
| Response details | Refer to Response details. |
| Created by | Only available for monitors within policies. Displays who created the monitor and when. |
| Last edited | Only available for monitors within policies. Displays who last edited the monitor and when. |
On the device summary page, navigate to the Monitors card and click the description of a standalone monitor to open the monitor detail pane. Refer to Monitors in Device summary.
NOTE Monitors within policies can only be edited in the policy. Refer to Editing a monitor within a policy.
NOTE The Threat Detection monitor is available only as part of an Endpoint Security policy. Refer to Datto Endpoint Security in Endpoint Security policy.
NOTE The Windows Defender Antivirus monitor is only available as part of an Endpoint Security policy. Refer to Managed Windows Defender Antivirus in Endpoint Security policy.
You can edit a standalone monitor in the following ways:
- To update the monitor details, click the Edit button. Refer to Alert details per monitor type and Response details.
NOTE The type of the monitor cannot be changed.
- To delete the monitor, click the Delete button. The monitor will be deleted immediately.
Notes
Monitors can be applied as standalone monitors at the device level or as part of a Monitoring policy at either the site or the account level. For more information, refer to Monitoring policy.
In addition to setting up your own policies, a selection of Monitoring policies is freely available to download from the ComStore or the Policies page. These include best practices to monitor the most common platforms and applications such as Exchange and SQL.
These Monitoring policies aim to provide a best-practice solution for the most typically encountered usage scenarios involving Datto RMM. However, they only serve as guidelines and may require modification depending on device configuration. (For example, ensure that network Monitoring policies are querying the correct SNMP OIDs of your devices.)
We encourage you to try these policies on your own devices to provide a solid, baseline monitoring solution to which your own monitoring can be added. Once added to your account, a policy downloaded from the ComStore or the Policies page becomes a regular Monitoring policy, which can be configured and modified as required. Targets typically must be configured before use.
For more information, refer to the following topics: Download a ComStore policy and Best practices for Monitoring policies (general topic that includes detailed information on the criteria monitored in some of the policies).
Thresholds
- An Event Log monitor can raise 100 identical alerts per device in 24 hours.
- An Event Log monitor can raise 600 unique alerts per device in one hour and 1,200 unique alerts per device in 24 hours.
- Any other monitor can raise 60 unique alerts per device in one hour and 120 unique alerts per device in 24 hours.
Actions
Once a monitor hits any of the limits listed above, the following actions are taken automatically:
- The monitor will be disabled on the device that has exceeded the threshold. The Enabled toggle in the Monitors card on the device summary page will be set to Disabled. Refer to Monitors.
- The action of disabling the monitor through alert rate limiting will be logged in the Activity Log. Refer to Activity Log.
- A notification email will be sent to all users with the Administrator security level (max. 50 users) to inform them that the monitor has been disabled on the device due to alert rate limiting.
NOTE Online Status monitors do not get disabled through alert rate limiting.
NOTE The alert counter is reset at the end of every hour and at 00:00 UTC.


