Device summary
PERMISSIONS Refer to Sites > Devices in Permissions.
PERMISSIONS Refer to Global > Policies and Sites > Policies in Permissions.
PERMISSIONS For the Create a Maintenance Mode Window action button and the Monitors card, also refer to Sites > Monitor in Permissions.
PERMISSIONS For the Quick Job, Create a Job, Patch Now, and Schedule Reboot action buttons, also refer to Jobs > Active Jobs in Permissions.
PERMISSIONS For the Create a Report and Quick Report action buttons, also refer to Reports > Active Reports in Permissions.
PERMISSIONS For the Request Audit action button, also refer to Sites > Audit in Permissions.
PERMISSIONS For the Send Message action button, also refer to Setup > Messages in Permissions.
PERMISSIONS For the Download Agent Logs action button, also refer to Remote control tools.
PERMISSIONS For the Isolate and Revert Isolation action buttons in the Security card, also refer to Jobs > Active Jobs in Permissions.
PERMISSIONS For some action buttons, the respective remote control tool must be enabled. Refer to Remote control tools.
PERMISSIONS For devices integrated with Webroot SecureAnywhere Endpoint Protection, Windows Defender Antivirus, and Endpoint Security by Bitdefender, you must have permission to run jobs on the device. Refer to Jobs > Active Jobs in Permissions.
PERMISSIONS For the patch status Manual Override button, also refer to Sites > Devices in Permissions.
NAVIGATION Devices > All > click the hostname of a device
NAVIGATION Devices > click the name of any previously accessed device
NAVIGATION A targeted list of devices > click the hostname of a device. To view the navigation paths for the various targeted lists of devices, refer to Targeted lists of devices in Devices.
NAVIGATION Sites > All Sites > click the name of a site > click the hostname of a device
NAVIGATION Dashboards > click the name of a dashboard > click an area of any device widget to drill into a list of devices > click the hostname of a device
NAVIGATION Sites > All Sites > click the name of a site > click the name of a dashboard (left navigation menu) > click the hostname of a device
NAVIGATION Site Groups page > click the name of a Site Group > click the name of a site > click the hostname of a device. To view the various navigation paths you can use to access the Site Groups page, refer to Site Groups.
NAVIGATION Job results page > click the hostname of a device. To view the various navigation paths you can use to access the job results page, refer to Job results.
Device name, icons
The device summary page provides easy navigation to locate all relevant information about a device efficiently. It is touchscreen friendly and offers visual cues on a single, intuitive page to guide you to the information you need the most.
You may see the following visual indicators next to the device name: 
- The device is online (green circle) or offline (transparent circle).
- The operating system of the device when the information is available.
- The device has Privacy Mode enabled.
- The device is in maintenance mode.
NOTE If a device's online/offline or Privacy Mode status changes, the respective status icon is automatically refreshed 60 seconds after the change.
Action buttons
Different device types have different action buttons displayed at the top of the page. To access all action buttons, you may need to click the More icon at the end of the row or hover over the V icon next to the Agent Browser button. The table below lists the available action buttons per device type. Further down, you will find information about each action button.
| Action Button | Server/Laptop/Desktop | Network Device | Printer | Datto Networking | Datto Continuity | ESXi | ||||||
|---|---|---|---|---|---|---|---|---|---|---|---|---|
| Access Point | Switch | Managed Power | ALTO | SIRIS | vSIRIS | Datto Backup for Microsoft Azure | Datto Endpoint Backup with Disaster Recovery | |||||
| Web Remote |
|
|
|
|||||||||
| Agent Browser |
|
|
|
|
|
|
||||||
| RDP | From Windows to Windows |
|
|
|||||||||
| Splashtop | From Windows and macOS to Windows and macOS |
|
|
|||||||||
| PowerShell | From Windows to Windows |
|
|
|||||||||
| Open in PSA |
|
|
|
|
|
|
|
|
|
|||
| View in ConnectWise |
|
|
|
|
|
|
|
|
|
|||
| Quick Job |
|
|
|
|||||||||
| IT Glue |
|
|
|
|
|
|
|
|
|
|||
| Move to Another Site |
|
|
|
|
|
|
||||||
| Create a Maintenance Mode Window |
|
|
|
|
|
|
|
|
|
|||
| Create a Job |
|
|
|
|||||||||
| Quick Report |
|
|
|
|||||||||
| Create a Report |
|
|
|
|||||||||
| Request Audit |
|
|
|
|
|
|
||||||
| Create Ticket |
|
|
|
|
|
|
||||||
| Send Message | Windows and macOS |
|
|
|||||||||
| Enable Privacy Mode | Windows, macOS, and Linux laptops and desktops |
|
|
|||||||||
| Patch Now | Windows |
|
|
|||||||||
| Schedule Reboot |
|
|
|
|||||||||
|
|
|
|
|
|
|
|
|
|
|
|
|
|
| Delete |
|
|
|
|
|
|
||||||
| Webroot SecureAnywhere Endpoint Protection | Windows |
|
|
|||||||||
|
Windows |
|
|
|
|
|
|
|
|
|
|
|
|
| Endpoint Security | Windows |
|
|
|||||||||
| Datto AV |
|
|
|
|||||||||
| Create a Device Group |
|
|
|
|
|
|
|
|
|
|
|
|
| Add to Existing Device Group |
|
|
|
|
|
|
|
|
|
|
|
|
| Remove from Existing Device Group |
|
|
|
|
|
|
|
|
|
|
|
|
| Copy Device Information to Clipboard |
|
|
|
|
|
|
|
|
|
|||
| Download Agent Logs |
|
|
|
|||||||||
| Reboot |
|
|
|
|
|
|||||||
| Network Manager |
|
|
|
|
|
|||||||
| Connect |
|
|
|
|||||||||
| Open in Portal |
|
|
|
|
|
|||||||
| Recovery Launchpad |
|
|
|
|
|
|||||||
Only displayed for online devices and if the Web Remote option is turned ON in the Remote Control Tools section of your security level. Click the button to connect to the device using a Web Remote session. The session will open in a new browser tab.
IMPORTANT Web Remote sessions can be initiated from Windows, macOS, Linux, iOS, or Android devices using a recent version of the Chrome, Firefox, Edge, or Safari browser; no installed Agent is required. However, only Windows and macOS devices with a Managed Agent installed can be controlled via a Web Remote session.
IMPORTANT For Web Remote to function properly on macOS devices running Mojave or later, enable the following permissions for AEM Agent in System Preferences > Security & Privacy > Privacy (System Settings > Privacy & Security > Privacy for Ventura):
• Accessibility
• Full Disk Access
• Screen Recording
If a macOS device that was working before a release is suddenly not allowing a Web Remote connection, check these permissions and reconfigure them if needed.
NOTE Web Remote does not use Proxy settings when establishing a connection.
For more information, refer to Web Remote.
Only displayed for online devices and if the RDP option is turned ON in the Remote Control Tools section of your security level. Click the button to initiate a connection to the device using the Agent Browser. You will automatically be logged in to the Agent Browser. Once you are connected to the device, you will be presented with a list of actions you can perform on it. For further information, refer to Agent Browser tools.
IMPORTANT A connection through the Agent Browser can only be initiated from Windows devices with a Managed Agent installed. OnDemand Agents and operating systems other than Windows do not have an Agent Browser.
Only displayed for online devices and if the RDP option is turned ON in the Remote control tools section of you security level. Hover over the V icon next to the Agent Browser button and click RDP to connect to the device using RDP. The connection can be initiated from a Windows device to a Windows device.
For more information, refer to RDP.
Only displayed for online devices and if the Splashtop Integration is enabled and the RDP option is turned ON in the Remote control tools section of you security level. Hover over the V icon next to the Agent Browser button and click Splashtop to connect to the device using Splashtop. The connection can be initiated from a Windows or macOS device to a Windows or macOS device.
For more information, refer to Splashtop Remote Screen Share Integration.
Only displayed for online devices and if the PowerShell option is turned ON in the Remote control tools section of you security level. Hover over the V icon next to the Agent Browser button and click PowerShell to connect to the device using PowerShell. The connection can be initiated from a Windows device to a Windows device.
For more information, refer to PowerShell.
Only displayed if the Autotask Integration is enabled and the device is synced to Autotask. Refer to Autotask Integration.
The tooltip on the button informs you about the Last Autotask Sync Date and the Last Autotask Verify Date. Click the button to access the mapped configuration item in Autotask in a new browser tab. If you were already logged in to Autotask or single sign-on is configured for you, you will be directed to the configuration item page. If you are not logged in to Autotask, you will be required to enter your login credentials first. For more information, click the question mark icon in the upper-right corner of the Autotask page. You will automatically be directed to the appropriate topic in the Autotask Help system.
Only displayed if the ConnectWise PSA Integration is enabled and the device is synced to ConnectWise PSA. Refer to ConnectWise PSA Integration.
Click the button to view the device in ConnectWise PSA in a new browser tab. If you were already logged in to ConnectWise, you will be directed to the device's configuration page. If you are not logged in, you will be required to enter your login credentials first.
Click the button to run a quick job against the device. Refer to Quick jobs.
Only displayed if the IT Glue Integration is enabled. Refer to IT Glue Integration.
Click the button to open the IT Glue pane on the right side of the page. Refer to IT Glue pane in Datto RMM.
If the integration is turned on but you have not yet authenticated the integration as a user, click Authenticate in the pane to log in to IT Glue and complete the user authentication.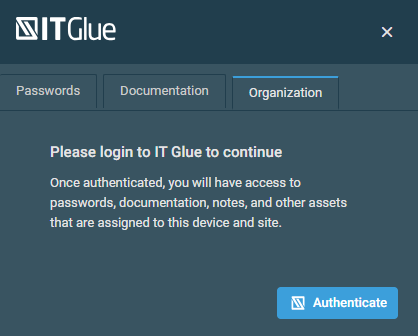
There are times when you want to free up your Managed licenses as you no longer need to have unattended access to those devices. However, sometimes you need to be getting more regular audit information of certain devices and the ability to run jobs on them, so you would need to move them to a Managed site. You may even want to move a device from one site to another because the device was added to the wrong site.
Switching devices between Managed and OnDemand sites is possible in both directions as long as you have enough free licenses available of whichever site type you are trying to convert to, otherwise the device will stay in its original site. For billing purposes, devices will retain their site type until they connect to the server. This means that if you are at your purchased Managed device limit and move some Agents to an OnDemand site to free up Managed device licenses, those licenses won't be available for use by new devices until the Agents you moved have finished checking in to the platform.
To move a device from one site to another, follow these steps:
- Click Move to Another Site.
- In the confirmation dialog box that appears, enter the name of the site you want to move your device to, then select it from the list. The search results are narrowed as you type.
- Click Move to execute the action or Cancel to close out of the dialog box. If the device you are trying to move is a Network Node, it will be indicated on the Choose a site page.

NOTE When you move a device to a different site, the device's association to its Network Node will remain unchanged. If you move a Network Node device to another site, it will keep its Network Node status in the new site and its association to network devices will remain unchanged. For more information, refer to the Assigned Network Node field in the Summary card.
NOTE Datto Networking or Datto Continuity devices cannot be moved between Datto RMM sites. If any Datto Networking or Datto Continuity devices are selected to be moved to another site along with Datto RMM devices, these devices will be excluded from the move, and a message is displayed prompting you to update the mapping. The selected Datto RMM devices will then be moved to the new site. Refer to Map RMM sites to Datto Networking networks or Map Datto Continuity devices to Datto RMM sites.
Creating an unscheduled maintenance mode window
You can place a device in an ad-hoc maintenance mode that will prevent alerts from being generated for a specified time frame.
- Click Create a Maintenance Mode Window.
- In the confirmation dialog box that appears, enter a reason for the maintenance.
- Choose a duration:
- For the next (1-100) hours: By default it is set for the next one hour.
- Until selected date and time: Use the calendar to set a date of expiry for the maintenance mode window.
The scheduled maintenance mode window will adhere to the time zone configured in Setup > My Settings. Refer to User Time Zone.
- Click OK to create the maintenance mode window or Cancel to close out of the dialog box.

NOTE Additional unscheduled maintenance mode windows can be created by following the same steps as outlined above. You can also place multiple devices in unscheduled maintenance mode through a single action on the Devices page. Refer to Action buttons.
NOTE You can also create a scheduled maintenance mode window through a policy. Refer to Maintenance policy.
Maintenance mode status indicator
Once a device has been placed into maintenance mode, an icon is displayed next to the device name at the top of the device summary page. A device can have multiple maintenance mode windows configured that are all displayed in this view. Hover over the icon to see if it is an unscheduled or scheduled maintenance mode window, when it is going to end, who created it and when, and what the reason was for the maintenance. When a device is in a scheduled maintenance mode window, you can click the policy name to see the policy details. Refer to Editing a policy.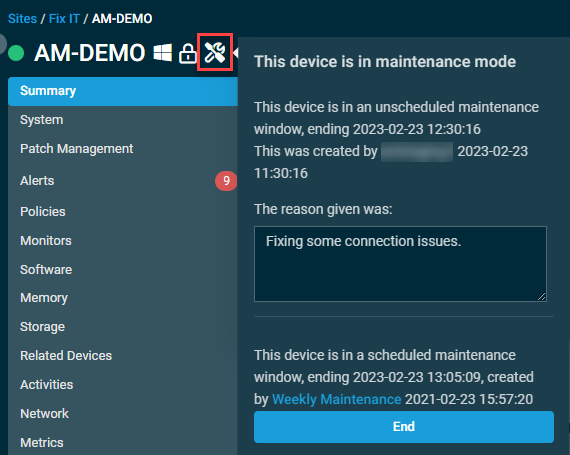
NOTE You can create a maintenance mode widget to see all devices currently in maintenance. Refer to Devices Under Maintenance.
Ending a maintenance mode window
- Hover over the maintenance mode icon. Refer to Maintenance mode status indicator.
- Click End. This will end all (both unscheduled and scheduled) maintenance mode windows configured for the device.
A pop-up notification will indicate if the maintenance window ended successfully, and the maintenance mode status indicator will disappear.
NOTE You can also end multiple devices' maintenance mode windows through a single action on the Devices page. Refer to Action buttons.
NOTE To end a scheduled maintenance mode window, you can also update the associated Maintenance policy so that it no longer targets the device. Refer to Editing a policy.
Refer to Scheduled jobs.
Refer to Quick reports.
Refer to Reports.
NOTE This action button is not available for OnDemand devices.
Click Request Audit to request a full audit of the device. For network devices, printers, and ESXi devices, this action button is only available if the device is assigned to a Network Node. Refer to the Assigned Network Node field in the Summary card. For more information about audits, including full and delta audits and their frequency, refer to Audits.
NOTE Full and delta audits can also be requested on device list pages. Refer to Request Audit.
IMPORTANT Device audits are rate limited. Only three audits may be performed per device over a five-minute time frame. This rate limiting applies to both full and delta audits.
NOTE Audit data is also available at the global and site levels. Refer to Alerts, Global and site-level patches summary lists, Software, and Hardware.
Refer to Creating a ticket.
NOTE This action button is not available for OnDemand devices.
- Click Send Message.
- Enter a subject (optional field) and a message.
- Select the Expire this message after ... minutes check box if you wish to stop attempting to send the message to an offline device after the number of minutes specified here. By default, this time period is set to 10 minutes.
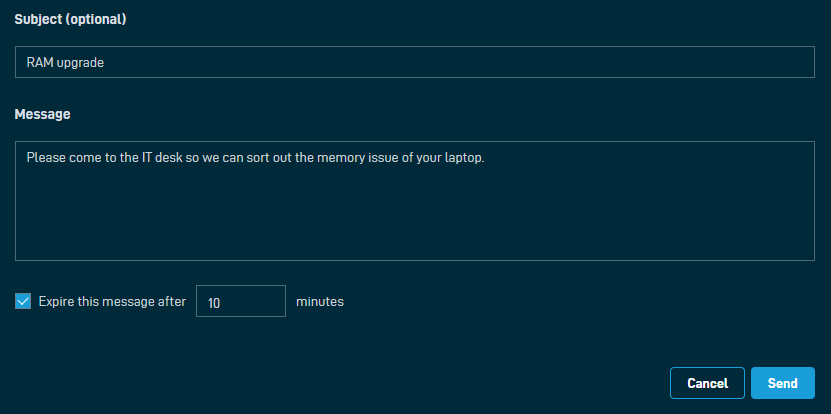
- Click Send. The message will appear on the device once it is online.
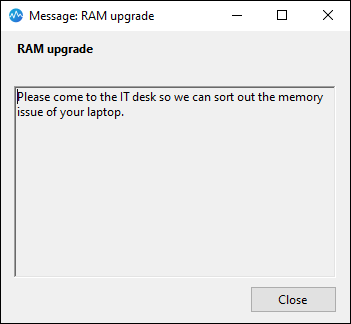
NOTE You can also send a message to multiple devices through a single action on the Devices page. Refer to Action buttons.
IMPORTANT Privacy Mode cannot be disabled from the web interface. Once enabled, it can only be disabled by the end user on the device itself. For more information, refer to Privacy Mode.
Refer to Privacy Mode for information about this action.
NOTE This menu item is unavailable and shows a lock icon if Privacy Mode is already enabled on the device. 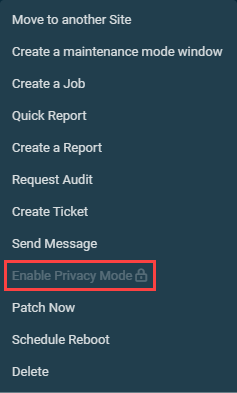
- Click Enable Privacy Mode and observe the dialog box that appears.
- If the device is eligible to have Privacy Mode enabled, select the check box and click Enable Privacy Mode to execute the action or Cancel to close out of the dialog box.
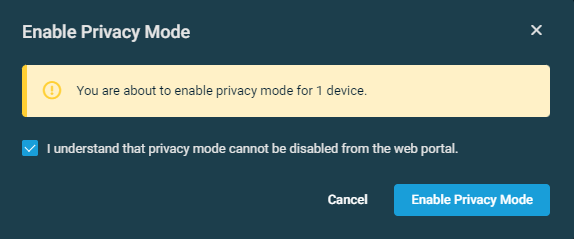
If completed, a pop-up notification will indicate that one device is marked to have Privacy Mode enabled.
NOTE Once Privacy Mode is enabled, a lock icon will appear next to the device name. Refer to Device name, icons.
NOTE You can also enable Privacy Mode on multiple devices at once from a list of devices. Refer to Enable Privacy Mode.
This action button allows you to start the installation of approved patches on this device via a Patch Management policy. Patch installation will begin immediately, outside of the schedule configured in the policy targeting the device. For information about Patch Management, refer to Patch Management and Patch Management policy.
NOTE The Patch Now action button is unavailable if no Patch Management policy targets the device or if the Patch Management policy targeting the device is used for audit purposes only. The button is not available if the device is a non-Windows device.
NOTE This action button is also available in the Patch Management card for Windows devices only. Refer to Patch Management.
- Click Patch Now and observe the dialog box that appears.
- If one Patch Management policy targets the device, the name of the policy will be displayed in the dialog box. Select the I understand that this action is irreversible check box to confirm the action and click Patch to execute. Or, click Cancel to close out of the dialog box.
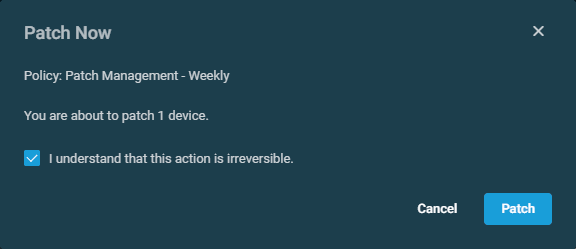
- If multiple Patch Management policies target the device, select the policy you want to run from the drop-down list. Select the I understand that this action is irreversible check box to confirm the action and click Patch to execute. Or, click Cancel to close out of the dialog box.
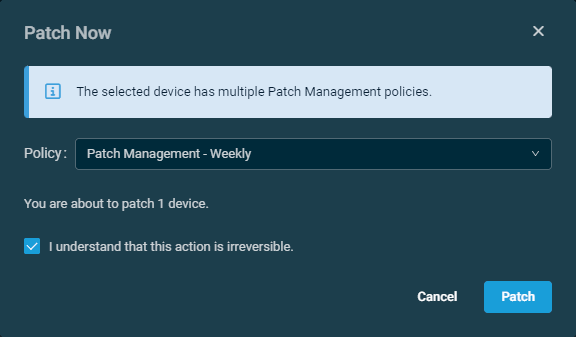
- If one Patch Management policy targets the device, the name of the policy will be displayed in the dialog box. Select the I understand that this action is irreversible check box to confirm the action and click Patch to execute. Or, click Cancel to close out of the dialog box.
- Once you click Patch, a dialog box will confirm that the request has been submitted successfully. The Patch Management policy will now run on the device and patch installation will begin. If the device is offline, the policy will run on it when it next comes online.
After the update has been installed, the device will either shut down, restart (if required), or not restart, depending on which of those settings is selected in the Patch Management policy. Refer to Power in Patch Management policy.
NOTE You can also patch multiple devices at once from a list of devices. Refer to Patch Now.
This action button allows you to reboot a Windows, macOS, or Linux device immediately or at a selected date and time. The reboot is performed by a component run on the device via a job.
- Click Schedule Reboot.
- In the dialog box, select one of the following options from the drop-down list:
- Immediately: The device will be rebooted one minute after the job creation.
- At selected date and time: The device will be rebooted at the selected date and time according to the time zone configured in Setup > My Settings. Refer to User Time Zone.
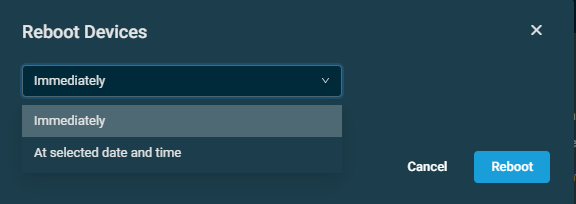
- Click Reboot to execute the action or Cancel to close out of the dialog box.
NOTE End users on Windows devices will see a notification to let them know that the device is being rebooted.
NOTE If the device is offline at the time when the scheduled reboot is due, the job will be queued until the device next comes online.
Once you click Reboot, the job will be listed as Reboot device [Hostname] on the Jobs page where you can delete it if necessary. Refer to Jobs overview.
NOTE This action button is also available in the Patch Management card for Windows devices only. Refer to Patch Management.
NOTE You can also reboot multiple devices using the Schedule Reboot action in any device list. Refer to Devices.
Refer to Deleting a device.
This action button is available only for devices that have Webroot SecureAnywhere Endpoint Protection installed. Select one of the following actions from the drop-down list.
NOTE You must have permission to run jobs on the device. Refer to Jobs > Active Jobs in Permissions.
NOTE At this time, the ability to run Webroot-specific remote actions is supported only on Windows operating systems.
| Action | Description |
|---|---|
| Update | Updates definitions on the device. |
| Full Scan | Runs a full system scan on the device. |
| Rearm | If real-time protection is disabled or paused, re-enables it. |
| Scan/Clean | Runs a scan on the device and automatically remove any detected infections. |
| Refresh Configuration | Triggers a program update by forcing the device to check in to the cloud. |
The remote action that you select will run as a quick job.
NOTE For more information, refer to Webroot SecureAnywhere Endpoint Protection.
This action button is available only for devices that have Microsoft Defender Antivirus or Microsoft Defender for Endpoint installed. Select one of the following actions from the drop-down list.
NOTE You must have permission to run jobs on the device. Refer to Jobs > Active Jobs in Permissions.
| Action | Description |
|---|---|
| Update | Updates the software on the device. |
| Quick Scan | Runs a quick scan on the device. |
| Full Scan | Runs a full system scan on the device. |
The remote action that you select will run via the Deploy Windows Defender for Endpoint [WIN] component, available from the ComStore. Refer to ComStore and Component Library for download instructions.
This action button is available only for devices that have Bitdefender Endpoint Security Tools installed. Select one of the following actions from the drop-down list.
NOTE You must have permission to run jobs on the device. Refer to Jobs > Active Jobs in Permissions.
| Action | Description |
|---|---|
| Update | Updates the software on the device. |
| Quick Scan | Runs a quick scan on the device. |
| Full Scan | Runs a full system scan on the device. |
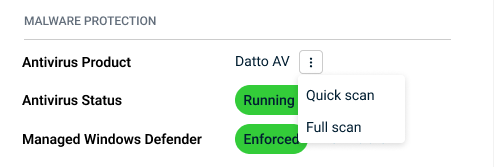
This action button is available only for devices that have Datto AV installed. Select one of the following actions from the drop-down list.
NOTE You must have permission to run jobs on the device. Refer to Jobs > Active Jobs in Permissions.
| Action | Description |
|---|---|
| Quick Scan | Runs a quick scan on the device. |
| Full Scan | Runs a full system scan on the device. |
Notes on functionality:
- A scan can be initiated only once per device per hour.
- Scan results are not shown in Datto RMM. Alerts will surface through Datto EDR if necessary.
- In-app toast messages confirm initiation or errors (for example, scan failed, AV not installed, or already run recently).
Refer to Action buttons.
Refer to Action buttons.
Click Copy Device Information to Clipboard to copy the following device information to the clipboard:
- ID (internal database ID)
- UID (unique identifier of the device)
- Site ID
- Hostname
- Operating system
- Site name
- Manufacturer
- Model
- .NET version
- Is 64-bit?
- Last audit date
- Agent version
- Last reboot date
- Patch status
- Antivirus status
- Antivirus product
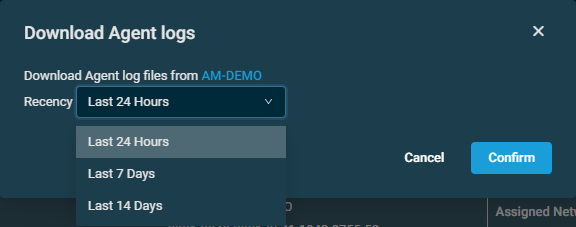
Click to download the Agent log files for this device. This option is only available when the device is online and has been approved. For more information, refer to Device approval.
From the confirmation dialog box that appears, select one of the following options from the drop-down menu:
Click Confirm to download the compressed file containing the relevant logs or Cancel to close out of the dialog box. A pop-up notification will display the download progress.
The downloaded file will include the following types of logs:
- aemagent.log
- log.txt (Windows devices) or aemagentlog.txt (macOS or Linux devices)
- networknode.log
- webremote.log
For more information, refer to Agent log files, Network Discovery log files, and Web Remote log files.
Click the button to reboot a Datto Networking device. For Managed Power devices, rebooting will only reboot the control board on the device, not the actual devices connected. Uptime will be displayed in the Summary card for the device after a reboot.
NOTE If you have at least View permission for Sites > Devices, then you can reboot Datto Networking devices. No additional permissions are required. Refer to Permissions.
Click the button to open the device in the Network Manager. For additional resources, search the Kaseya Helpdesk.
Connect to the Datto Continuity device in Datto Partner Portal. Only available when the Datto Continuity device is online. For additional resources, search the Kaseya Helpdesk.
NOTE If you have multiple Datto Partner Portal accounts, you may have to select the correct one that is tied to your Datto RMM account on the https://auth.datto.com/account-selection page for the redirect to work. As long as the selection is remembered in your cache, the redirect will be performed seamlessly.
Open the Datto Continuity device page in Datto Partner Portal. For additional resources, search the Kaseya Helpdesk.
NOTE If you have multiple Datto Partner Portal accounts, you may have to select the correct one that is tied to your Datto RMM account on the https://auth.datto.com/account-selection page for the redirect to work. As long as the selection is remembered in your cache, the redirect will be performed seamlessly.
Open the Recovery Launchpad in Datto Partner Portal. For additional resources, search the Kaseya Helpdesk.
NOTE If you have multiple Datto Partner Portal accounts, you may have to select the correct one that is tied to your Datto RMM account on the https://auth.datto.com/account-selection page for the redirect to work. As long as the selection is remembered in your cache, the redirect will be performed seamlessly.
Cards
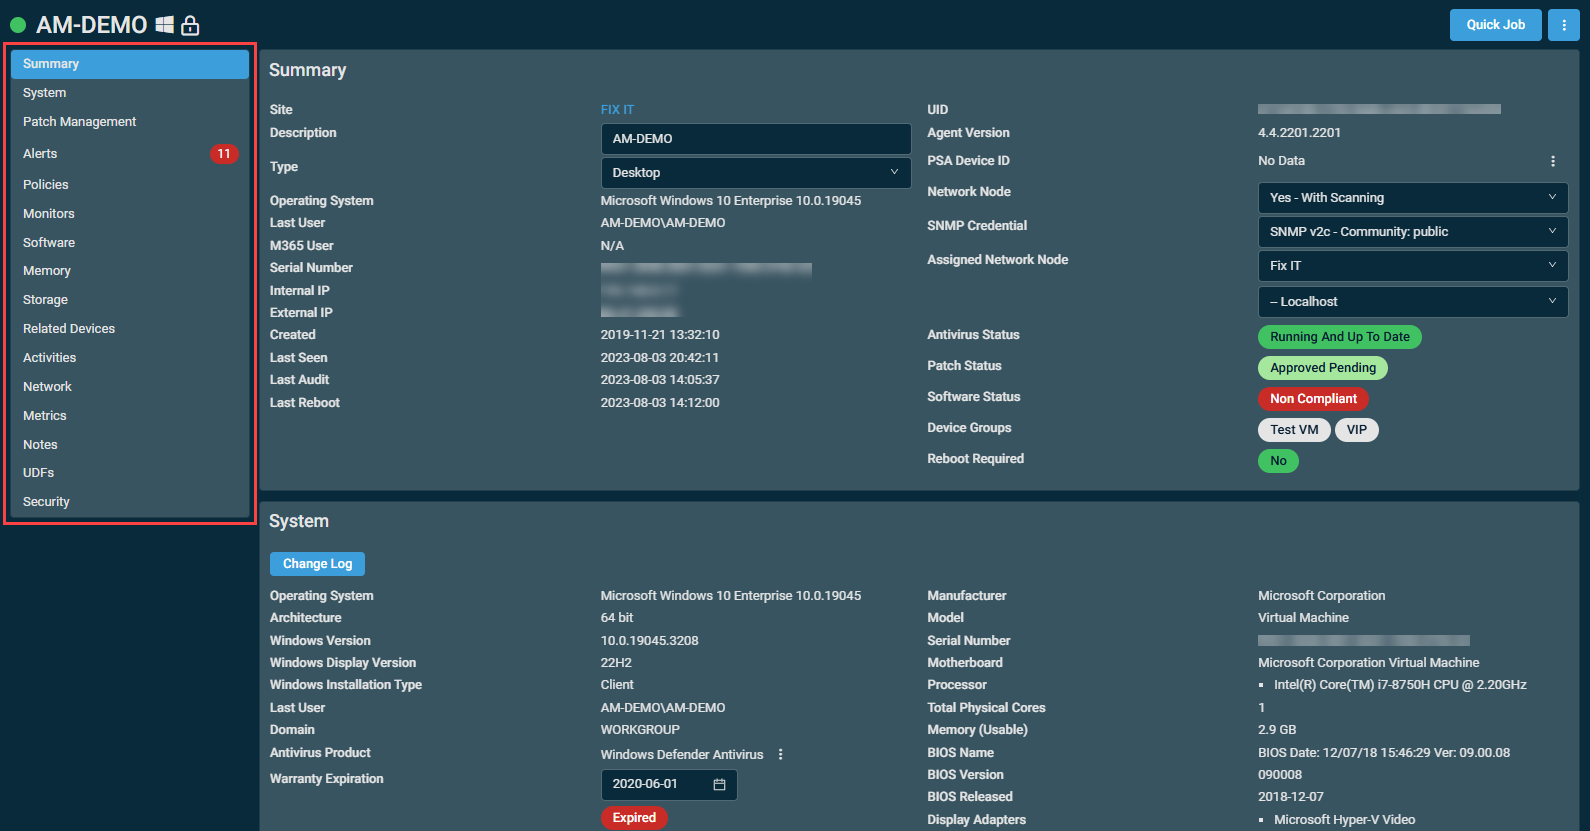
The device summary page displays a number of sections called cards that contain a wealth of information about your devices. Click the name of any of the cards on the left side of the page to jump straight to that section. On the right side of the page, you can drag and drop the cards to reorder them. The new order will persist for all devices of the same device type.
Time stamps reflect the user time zone and preferred date format configured on the Setup > My Settings page. Hovering over any time stamp will show its date in the alternative format. Refer to User Time Zone and Date Format.
Different device types have different cards available, and the cards may display different fields depending on the device type. The table below lists the available cards per device type. Further down, you will find information about each card type.
| Card | Server/Laptop/Desktop | Network Device | Printer | Datto Networking | Datto Continuity | ESXi | ||||||
|---|---|---|---|---|---|---|---|---|---|---|---|---|
| Access Point | Switch | Managed Power | ALTO | SIRIS | vSIRIS | Datto Backup for Microsoft Azure | Datto Endpoint Backup with Disaster Recovery | |||||
| Summary |
|
|
|
|
|
|
|
|
|
|
|
|
| System |
|
|
|
|||||||||
| Patch Management | Windows |
|
|
|||||||||
| Alerts |
|
|
|
|
|
|
|
|
|
|||
| Policies |
|
|
|
|
|
|
|
|
|
|
|
|
| Monitors |
|
|
|
|
|
|
|
|
|
|||
| Software |
|
|
|
|
|
|
||||||
| Hardware |
|
|
|
|||||||||
| Memory |
|
|
|
|
|
|
|
|||||
| Storage |
|
|
|
|
|
|
|
|||||
| Hyper-V Guests |
|
|
|
|
|
|
||||||
| Related Devices |
|
|
|
|
|
|
|
|
|
|
|
|
| Protected Devices |
|
|
|
|
|
|||||||
| Datto Continuity |
|
|
|
|
|
|||||||
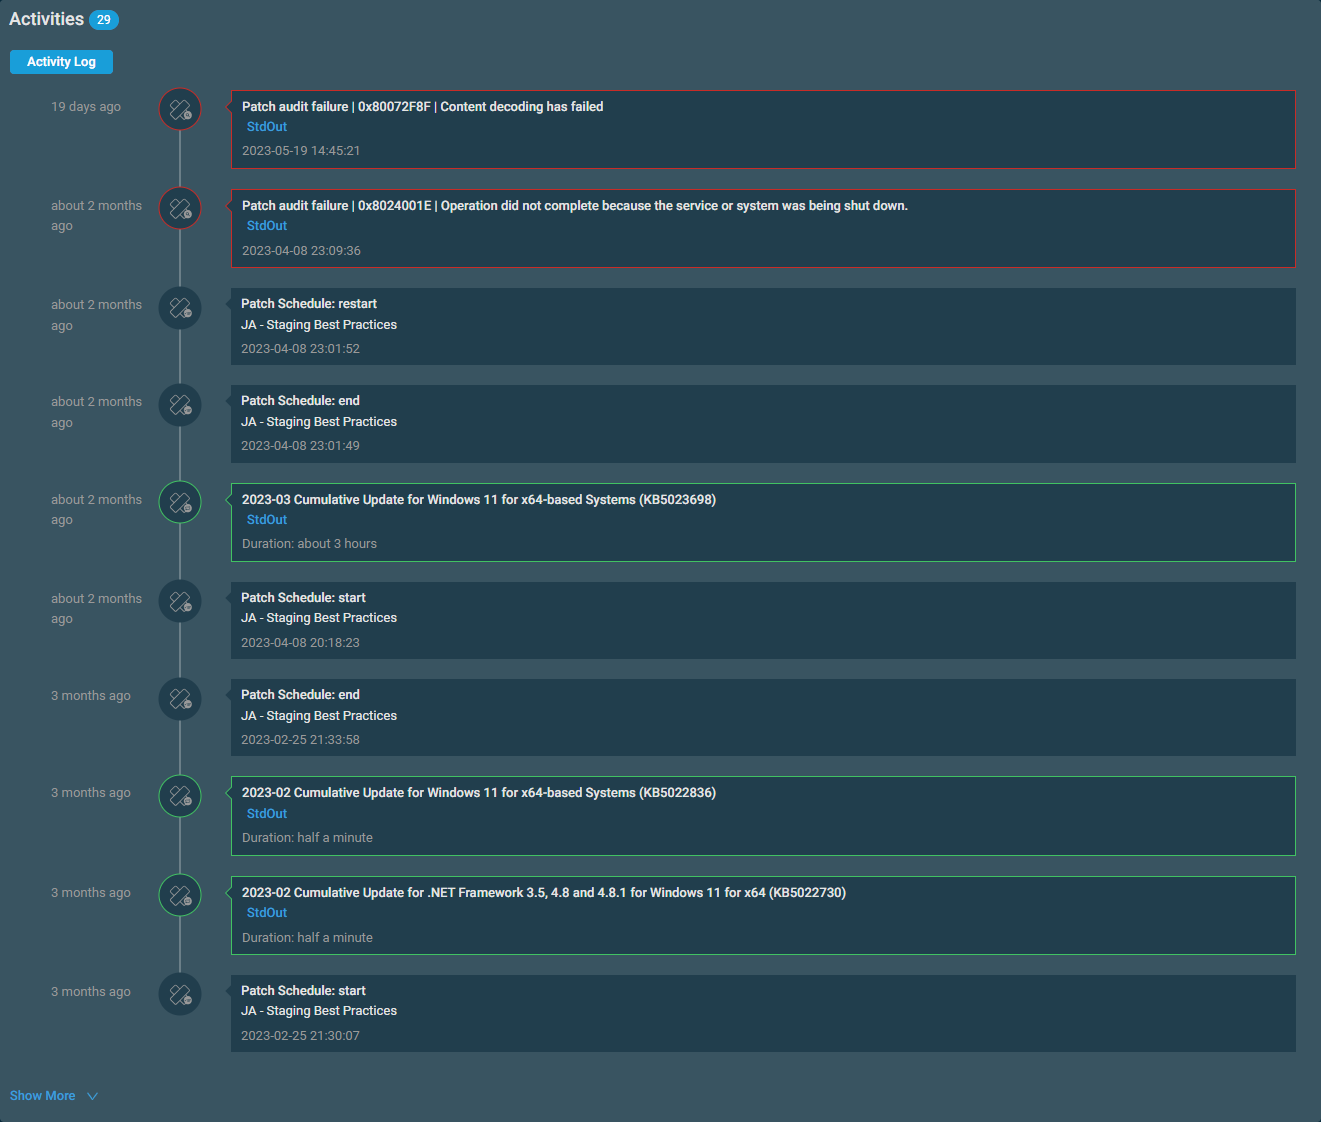
| Activities |
|
|
|
|
|
|
|
|
|
|||
| Network |
|
|
|
|
|
|
|
|||||
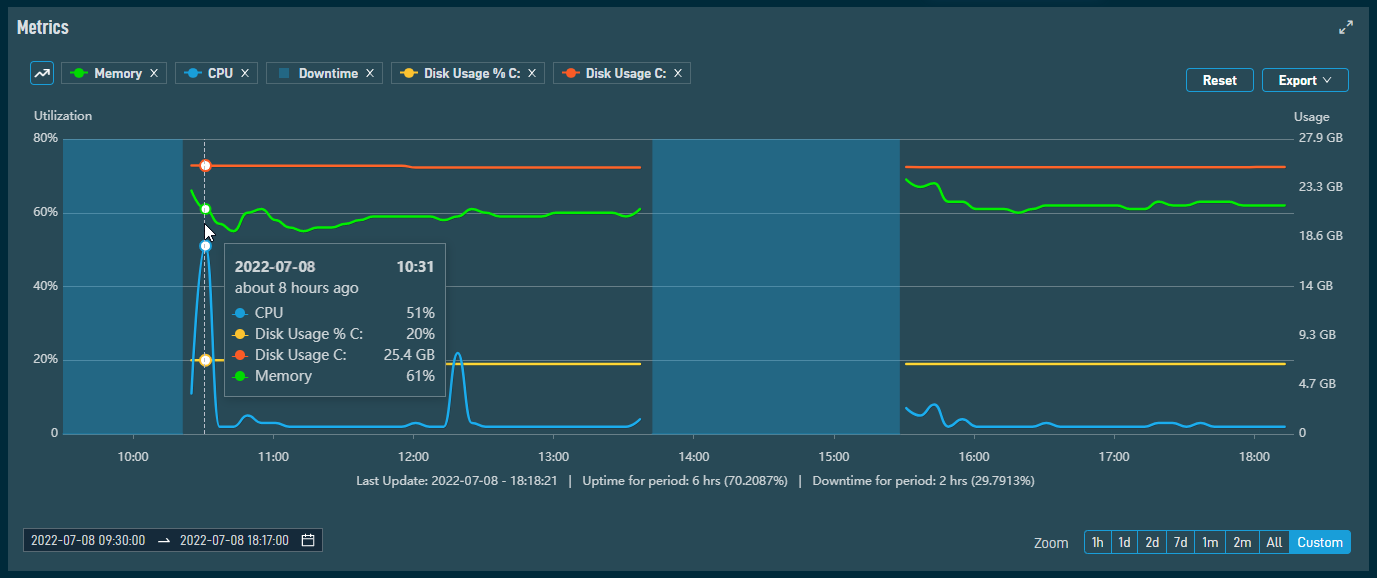
| Metrics |
|
|
|
|
|
|
||||||
| Notes |
|
|
|
|
|
|
|
|
|
|
|
|
| UDFs |
|
|
|
|
|
|
|
|
|
|
|
|
| Security |
|
|
|
|||||||||
| Supplies |
|
|
|
|
|
|
||||||
| Connected Devices |
|
|
|
|
|
|
||||||
| Network Traffic |
|
|
|
|
|
|
|
|||||
| Ports (Datto Switch) |
|
|
|
|
|
|
||||||
| Ports (Datto Managed Power) |
|
|
|
|
|
|
||||||
| Power Consumption |
|
|
|
|
|
|
||||||
| Guests |
|
|
|
|
|
|
||||||
The Summary card displays different fields depending on the device type.
For detailed information about this card, refer to Device Summary card.
The System card contains the following information:
| Field | Note |
|---|---|
| Operating System | |
| Architecture | |
| Service Pack | If the device's operating system does not have service packs, the field will not be displayed. Only available for Windows devices operating on Windows 7 or on Windows Server 2008 or older. |
| Windows Version | Only available for Windows devices. |
| Windows Display Version | Only available for Windows devices operating on Windows 10 or on Windows Server 2016 or newer. |
| Windows Installation Type | Only available for Windows devices. |
| Last User | |
| Domain | |
| Antivirus Product | Displays the antivirus product installed on the device. Refer to Antivirus products. For Webroot SecureAnywhere Endpoint Protection, Windows Defender Antivirus, or Bitdefender Endpoint Security Tools security products, you can leverage Datto RMM’s policy-driven Software Management technology to deploy these products to your endpoints. This includes automatic installation and reporting on widgets to review compliance. Refer to Supported software applications and operating systems. Click the drop-down menu to select an action to perform on the device. Refer to Datto AV, Webroot SecureAnywhere Endpoint Protection, Windows Defender Antivirus, or Endpoint Security. 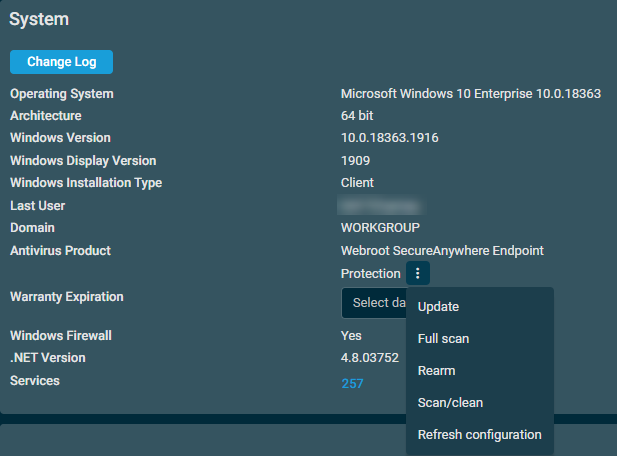 |
| Warranty Expiration |
This field displays the date the device's warranty expires or is blank if no date is set. If the date is in the past, the word Expired is highlighted in red underneath the date. This field is not populated automatically. Click in the field to update the date. Enter the date manually (YYYY-MM-DD) or choose it from the calendar. The change is saved automatically. NOTE Alternatively, you may consider using a third-party integration to populate this field. NOTE If the Autotask Integration is enabled, manual edits to the Warranty Expiration date will be synchronized to Autotask; however, removing the Warranty Expiration date in Datto RMM will not be synchronized to Autotask. If the Warranty Expiration date in Datto RMM is edited through an automatic method (for example, via a third-party integration), the change will only be synchronized if the Warranty Expiration field is empty in Autotask. NOTE If the ConnectWise PSA Integration is enabled, the Warranty Expiration date will only be synchronized to ConnectWise PSA if it is not in ConnectWise PSA at the time of the initial synchronization. If a Warranty Expiration date has already been set within ConnectWise PSA, it will not be updated upon subsequent device synchronization with Datto RMM. |
| Windows Firewall | Only available for Windows devices. |
| .NET Version | Only available for Windows devices. |
| Hyper-V Version | Only displayed for Hyper-V-enabled Windows devices. |
| Services | Refer to Services. |
| Manufacturer | |
| Model | |
| Serial Number | |
| Motherboard | |
| Processor | The information includes the name and speed of the processor. |
| Total Physical Cores | |
| Memory (Installed) | The total physical installed memory. |
| Memory (Usable) | The total physical installed memory minus "hardware reserved" memory. |
| BIOS Name | |
| BIOS Version | |
| BIOS Released | |
| Display Adapters | |
| Monitors |
Available for Windows, macOS, and Linux devices, the Change Log action button allows you to open a full-screen log of system, software, and hardware changes on the device. By default, the log displays all types of changes from the last 30 days.
At the top of the Change Log page, click System, Software, or Hardware to filter the list by the respective type of change.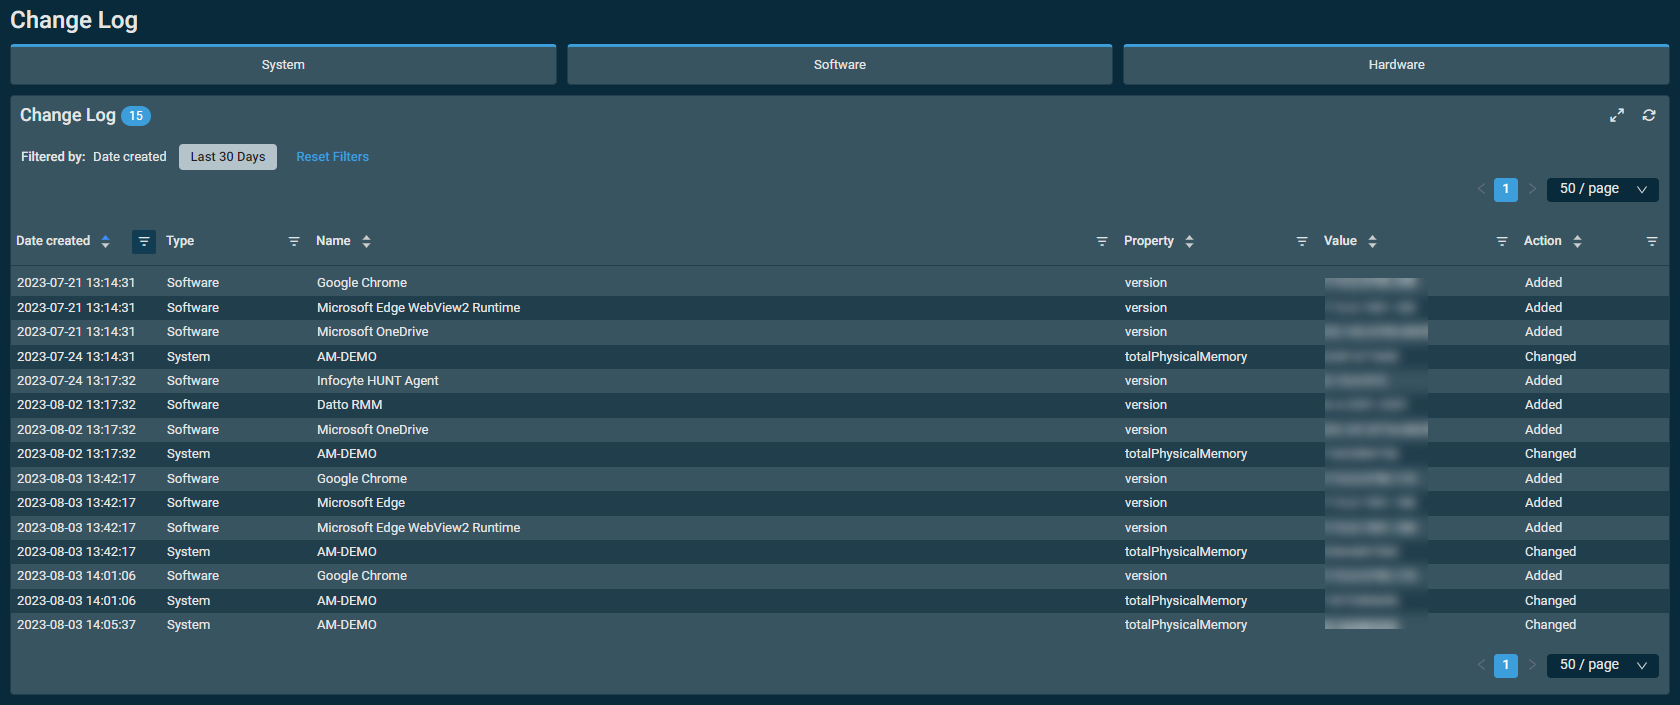
NOTE The Change Log does not include entries for attached devices, such as printers and USB drives.
The table displays the following information:
| Column | Sortable? | Description |
|---|---|---|
| Date Created |
|
Displays when the change occurred. Time stamps reflect the user time zone and preferred date format configured on the Setup > My Settings page. Hovering over any time stamp will show its date in the alternative format. Refer to User Time Zone and Date Format. Click the filter icon |
| Type | Displays the type of change, addition, or deletion, which can be one of the following:
To narrow the list, click the filter icon |
|
| Name |
|
Displays the name of the change. To narrow the list, click the filter icon |
| Property |
|
Displays the change property. To narrow the list, click the filter icon |
| Value |
|
Displays the change value. To narrow the list, click the filter icon |
| Action |
|
Displays the action, which can be one of the following:
To narrow the list, click the filter icon |
You can filter any columns with the filter icon ![]() . The Filtered by bar displays all applied column filters. If a filter search term includes wildcard characters (for example, underscores and percent signs), they serve as normal characters if they are preceded by a backslash. For details, refer to Wildcard characters. Click the X next to any filter to remove that filter. Click Reset Filters to return to the default view (Date created: Last 30 Days). The filter selection in the columns will persist the next time the page is accessed.
. The Filtered by bar displays all applied column filters. If a filter search term includes wildcard characters (for example, underscores and percent signs), they serve as normal characters if they are preceded by a backslash. For details, refer to Wildcard characters. Click the X next to any filter to remove that filter. Click Reset Filters to return to the default view (Date created: Last 30 Days). The filter selection in the columns will persist the next time the page is accessed.
The table density is set to condensed theme by default. To change it to relaxed theme, click the density toggle icon. ![]() The selection will persist across all pages.
The selection will persist across all pages.
The refresh icon ![]() allows you to reload the data while keeping existing filters when already configured.
allows you to reload the data while keeping existing filters when already configured.
The number of results displayed can be specified by selecting the desired number from the pagination control. This selection will persist the next time the page is accessed.
In the Services field in the System card, click the number of Windows device services to open a list of details.
At the top of the Services page, click All, Stop, Running, or Disabled to filter the list by the respective status at the last audit or startup type.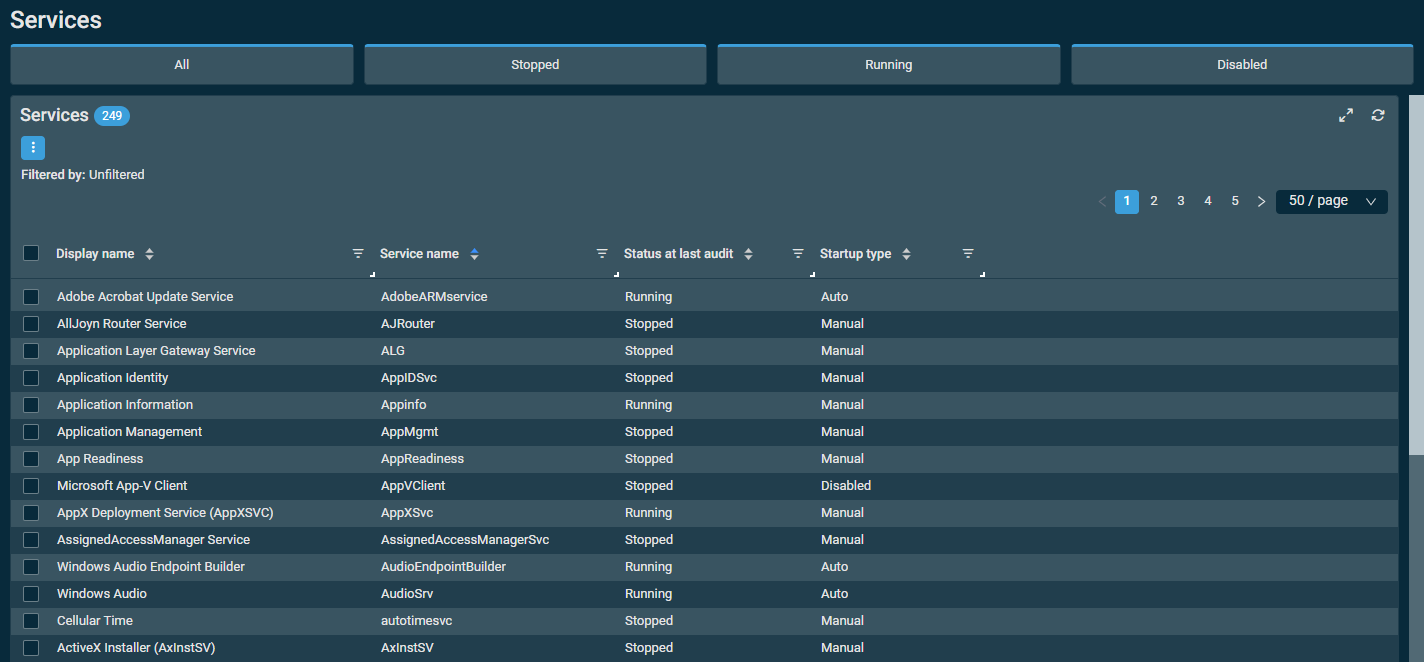
The table displays the following information:
| Column | Sortable? | Exportable? | Description |
|---|---|---|---|
| Display Name |
|
|
The display name of the Windows service. To narrow the list, click the filter icon |
| Service Name |
|
|
The abbreviated name of the Windows service. To narrow the list, click the filter icon |
| Status at Last Audit |
|
|
The status of the Windows service at the last audit, which can be one of the following:
To narrow the list, click the filter icon |
| Startup Type |
|
|
The startup type of the Windows service, which can be one of the following:
To narrow the list, click the filter icon |
The columns can be reordered and resized. The order and size of the columns will persist the next time the page is accessed.
You can filter any columns with the filter icon ![]() . The Filtered by bar displays all applied column filters. If a filter search term includes wildcard characters (for example, underscores and percent signs), they serve as normal characters if they are preceded by a backslash. For details, refer to Wildcard characters. Click the X next to any filter to remove that filter. If no filter is applied, the Filtered by bar displays Unfiltered. The filter selection in the columns will persist the next time the page is accessed.
. The Filtered by bar displays all applied column filters. If a filter search term includes wildcard characters (for example, underscores and percent signs), they serve as normal characters if they are preceded by a backslash. For details, refer to Wildcard characters. Click the X next to any filter to remove that filter. If no filter is applied, the Filtered by bar displays Unfiltered. The filter selection in the columns will persist the next time the page is accessed.
The table density is set to condensed theme by default. To change it to relaxed theme, click the density toggle icon. ![]() The selection will persist across all pages.
The selection will persist across all pages.
The refresh icon ![]() allows you to reload the data while keeping existing filters when already configured.
allows you to reload the data while keeping existing filters when already configured.
The number of results displayed can be specified by selecting the desired number from the pagination control. This selection will persist the next time the page is accessed.
Action buttons
The action buttons are unavailable if no row is selected or if the action is not applicable to the selected rows. The check boxes allow you to select one or more rows. Select all rows shown on the page by selecting the check box in the table header. To access all action buttons, click the Row Actions icon. The table below lists all available action buttons.
Action buttons
| Action Button | Description |
|---|---|
| Activity Log | Opens the Activity Log page specific to this device, filtered to only show Patch category activity from the last 24 hours. Refer to Activity Log. |
| Schedule Reboot | Refer to Schedule Reboot. |
| Patch Now | Refer to Patch Now. |
Patch Management information
The Patch Management card contains the following information for Windows devices:
| Field | Note |
|---|---|
| Patch Status | The highlight legend is as follows:
Refer to Determining a device's patch status. |
| Reboot Required | Displays one of two values:
Refer to How does Datto RMM determine if a reboot is needed? |
| Patches Installed | Click the number of patches to open a table of patch audit information for the device. The list of patches will be filtered by Installed. Refer to Patches summary list. |
| Patches Approved Pending | Click the number of patches to open a table of patch audit information for the device. The list of patches will be filtered by Approved Pending. Refer to Patches summary list. |
| Patches Not Approved | Click the number of patches to open a table of patch audit information for the device. The list of patches will be filtered by Not approved. Refer to Patches summary list. |
| Windows Update Server | If not available for the device, the field will not be displayed. |
| Windows Update Status Server | If not available for the device, the field will not be displayed. |
| Windows Update Agent Version | Displays the version number of the Windows Update Agent (WUA) software on the device. |
| Windows Update Service Start Type | Displays the startup type of the Windows Update service. This field should typically display Automatic. |
| Windows Update Source | Determined by a Windows Update policy. This field may show Microsoft or WSUS. Refer to Windows Update policy. |
| Update Microsoft Products | Displays whether the device receives updates for all Microsoft software or only for Windows, which can be determined by a Windows Update policy. Refer to Windows Update policy. |
| Windows Update Disabled | Displays whether the Windows Update service has been disabled on the device. This field should show No. |
Table information
Patch Management policy
The table at the bottom of the card displays the following information:
| Column | Description |
|---|---|
| Name | Displays the name of the Patch Management policy targeting the device. Click the policy name to view or edit its details. Refer to Patch Management policy. An overridden policy will show the override data, not the original data. Refer to Overriding a global Patch Management policy at the site level. |
| Last Run | Displays when the Patch Management policy last ran. Time stamps reflect the user time zone and preferred date format configured on the Setup > My Settings page. Hovering over any time stamp will show its date in the alternative format. Refer to User Time Zone and Date Format. |
| Scheduled | Displays the schedule of the Patch Management policy. Refer to Schedule. If the policy has an overridden schedule, this column shows the override schedule, not the original schedule. Refer to Overriding a global Patch Management policy at the site level. If the policy was scheduled to run once at a selected date and time, this column shows the date and time as a time stamp. Time stamps reflect the user time zone and preferred date format configured on the Setup > My Settings page. Hovering over any time stamp will show its date in the alternative format. Refer to User Time Zone and Date Format. If the policy follows any other schedule, this column shows a short description of the schedule. |
Patches summary list
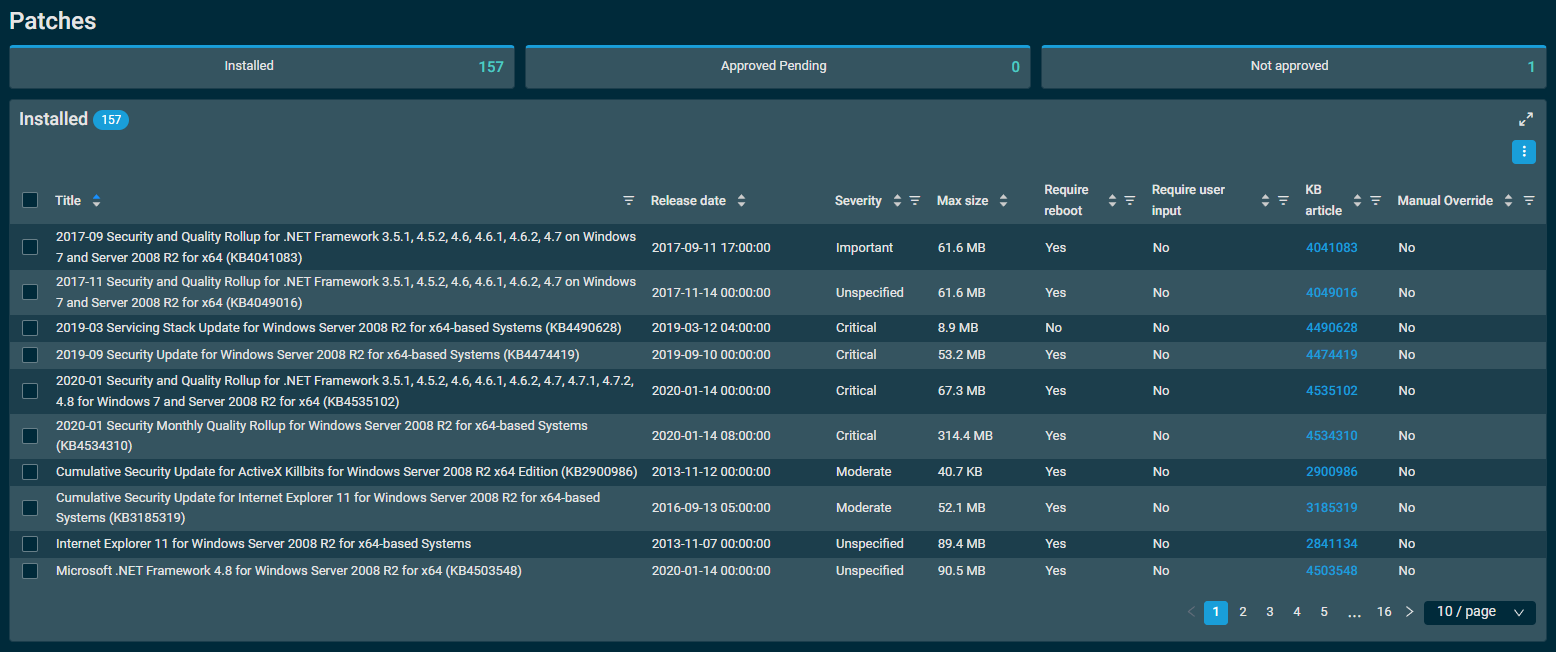
Open this table by clicking the number of patches in the Patches Installed, Patches Approved Pending, or Patches Not Approved field in the Patch Management card. The list of patches will be filtered by your selection.
Click any of the following categories to filter the list by that category:
- Installed: All of the patches that have been installed on the device.
- Approved Pending: All of the approved patches that will be installed on the device during the next patch window.
- Not approved: All of the patches that have been denied installation on the device.
NOTE In the Approved Pending and Not approved sections, you can select and change the approval status of individual patches. Any patches in the Approved Pending section you can mark as Do not approve, and patches in the Not Approved section you can mark as Approved. This will override the Patch Management policy applied to the device.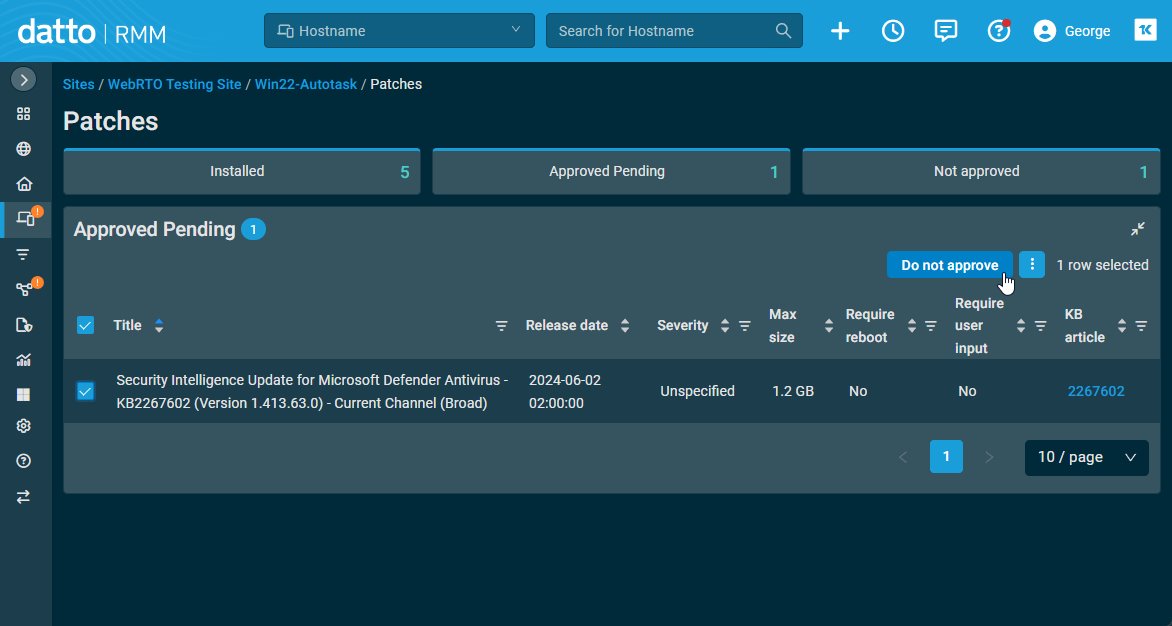
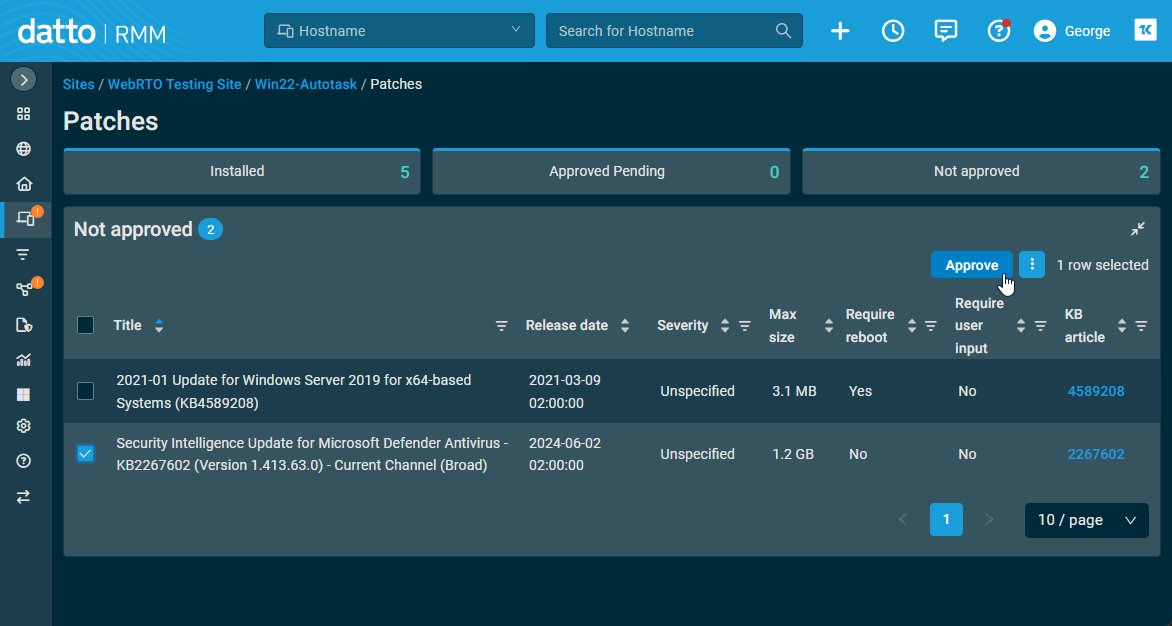
NOTE Only users with the Administrator security level, or that have a security level with Manage access in Sites > Devices, will be able to override patch approval at the device level.
The table displays the following information:
| Field | Sortable? | Description |
|---|---|---|
| Title |
|
The title of the patch. To narrow the list, click the filter icon |
| Release Date |
|
Displays when the patch was released. |
| Severity |
|
Displays the priority of the patch as specified in Microsoft Security Bulletins. Refer to About Microsoft Update classifications. Click the filter icon |
| Max Size |
|
Displays the maximum size of the patch, per Microsoft. NOTE While we show the maximum patch size, this is the size the patch could reach in an absolute worst case scenario, such as a device not having any of the previous updates leading up to that version of the patch. Because of this, in most cases, the actual download size of the patch will be less, sometimes much less, than the Max Size. |
| Require Reboot |
|
Displays if a reboot is required after the patch installation. Click the filter icon |
| Require User Input |
|
Displays if user input is required during the patch installation. Click the filter icon |
| KB Article |
|
Displays a Microsoft Knowledge Base article number that is associated with the patch. Click the number to open the associated article in a new tab. To narrow the list, click the filter icon |
| Manual Override |
|
Displays the individual override status of the patch. If the patch approval has been overridden at the device level, this field shows Yes. Otherwise, this field shows No. |
The table density is set to condensed theme by default. To change it to relaxed theme, click the density toggle icon. ![]() The selection will persist across all pages.
The selection will persist across all pages.
The number of results displayed can be specified by selecting the desired number from the pagination control. This selection will persist the next time the page is accessed.
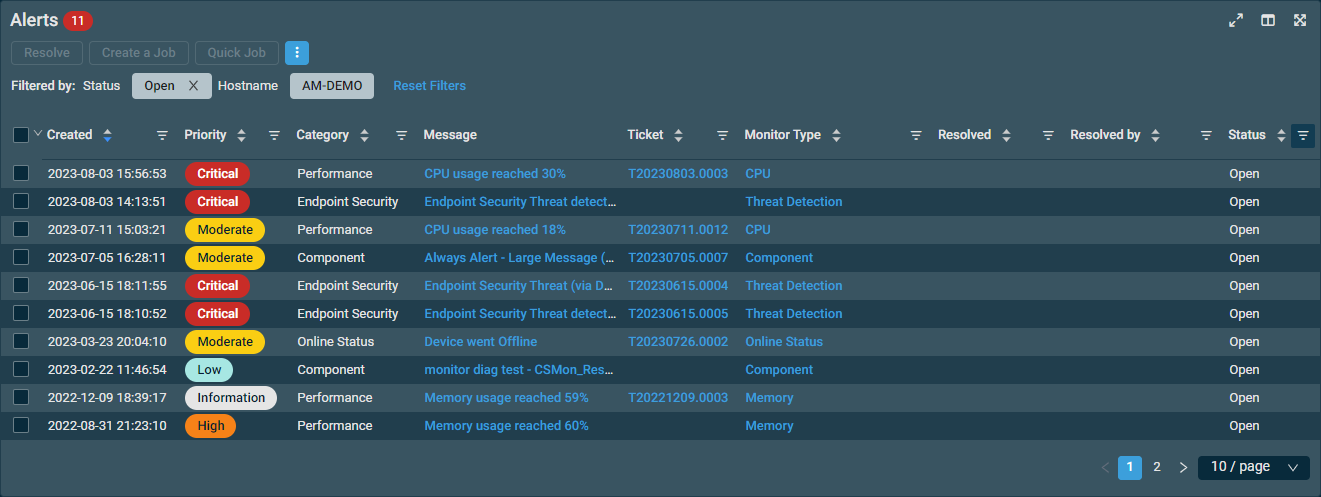
The Alerts card displays a list of the device's alerts. The card header has a badge showing the number of alerts. By default, the table displays all open alerts.
NOTE Alerts are retained for six months. An alert will be re-raised for any monitor that is in alert condition for more than six months.
NOTE There may be a mismatch between the badge count on the left-hand side (in the list of cards) and the badge count in the Alerts card header if column filters are applied. The badge count on the left-hand side shows the number of open alerts, while the card header will display the number of alerts based on the applied column filters.
Action buttons
To access all action buttons, click the Row Actions icon.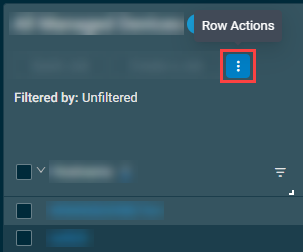
The action buttons are grayed out or become unavailable if no row is selected in the table or if the action button is not applicable to the selected rows. The check boxes allow you to select one or more rows. Select all rows shown on a page by selecting the check box in the table header. You can also use the drop-down arrow next to the check box in the table header to choose one of the following options: Select none, Select all on page, or Select all rows across all pages. If you choose to select all rows across all pages, the check boxes of the rows will not be selected; however, the page will indicate that all rows have been selected.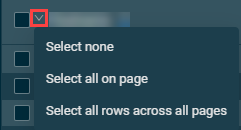
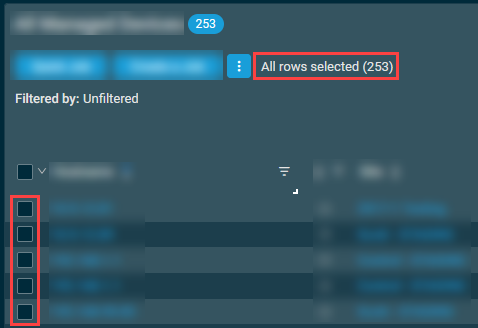
NOTE When all rows are selected across all pages, only certain action buttons are supported, which is indicated in the All Rows column in the table below.
| Action Button | All Rows | Description |
|---|---|---|
| Resolve |
|
Resolves the selected alert(s). If you have selected multiple alerts, a confirmation dialog box will appear. Click Confirm to execute the action or Cancel to close out of the dialog box. Once an alert is resolved, it will be removed from the table, and an update will appear in the Timeline card of the alert. Refer to Timeline. |
| Create a Job |
|
Refer to Scheduled jobs. NOTE This action button is unavailable if any selected alerts are for devices that are not servers, desktops, or laptops. |
| Quick Job |
|
Refer to Quick jobs. NOTE This action button is unavailable if any selected alerts are for devices that are not servers, desktops, or laptops. |
| Export Selected Rows to CSV | In the confirmation dialog box that appears, select whether to show table headers in the file by turning on the toggle for Show table headers in the exported CSV. Click Confirm to download the file or Cancel to close out of the dialog box. Any column selections, filters, and sorting that have been applied to the table will also be applied in the CSV file.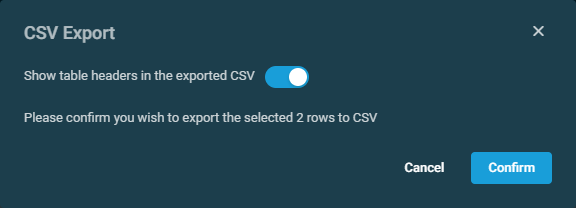 |
|
| Export All Rows to CSV |
|
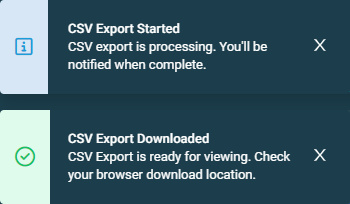
This action button is available only if all rows have been selected across all pages in the table. In the confirmation dialog box that appears, click Confirm to download the file or Cancel to close out of the dialog box. Pop-up notifications will inform you of the start and completion of the CSV export action. Click the X to close the notification; otherwise, the notification will automatically be cleared after five minutes. Any column selections, filters, and sorting that have been applied to the table will also be applied in the CSV file. |
| Uncheck All |
|
Clears all selected rows. The number of selected rows is indicated next to the Row Actions icon. NOTE This action button is not available if all rows have been selected across all pages in the table. To clear all selected rows across all pages, use the Select none option from the drop-down arrow next to the check box in the table header. |
You can filter any columns with the filter icon ![]() . The Filtered by bar displays all applied column filters. If a filter search term includes wildcard characters (for example, underscores and percent signs), they serve as normal characters if they are preceded by a backslash. For details, refer to Wildcard characters. Click the X next to any filter to remove that filter. Click Reset Filters to produce an unfiltered list. If no filter is applied, the Filtered by bar displays Unfiltered. The filter selection in the columns will not persist the next time the page is accessed as the table will return to the default view.
. The Filtered by bar displays all applied column filters. If a filter search term includes wildcard characters (for example, underscores and percent signs), they serve as normal characters if they are preceded by a backslash. For details, refer to Wildcard characters. Click the X next to any filter to remove that filter. Click Reset Filters to produce an unfiltered list. If no filter is applied, the Filtered by bar displays Unfiltered. The filter selection in the columns will not persist the next time the page is accessed as the table will return to the default view.
The table density is set to condensed theme by default. To change it to relaxed theme, click the density toggle icon. ![]() The selection will persist across all pages.
The selection will persist across all pages.
The Column Chooser icon ![]() allows you to select which columns should be visible in the list. Refer to Column Chooser field definitions for descriptions of all of the available fields.
allows you to select which columns should be visible in the list. Refer to Column Chooser field definitions for descriptions of all of the available fields.
The expand icon ![]() allows you to open the list in full-page mode with full functionality. By default, the page will display all results for the device. For details on the functionality available in the expanded view, refer to List of alerts.
allows you to open the list in full-page mode with full functionality. By default, the page will display all results for the device. For details on the functionality available in the expanded view, refer to List of alerts.
The number of results displayed can be specified by selecting the desired number from the pagination control. This selection will persist the next time the page is accessed.
NOTE To view all alerts at the global or site level, refer to Alerts.
The Policies card contains a list of the policies targeting this device.
Users can view this card if they have at least View access to Sites > Policies. Users can view global policies in the list if they also have View access to Global > Policies. The card header has a badge showing the number of policies in the list, which is updated depending on which filters are selected in the table.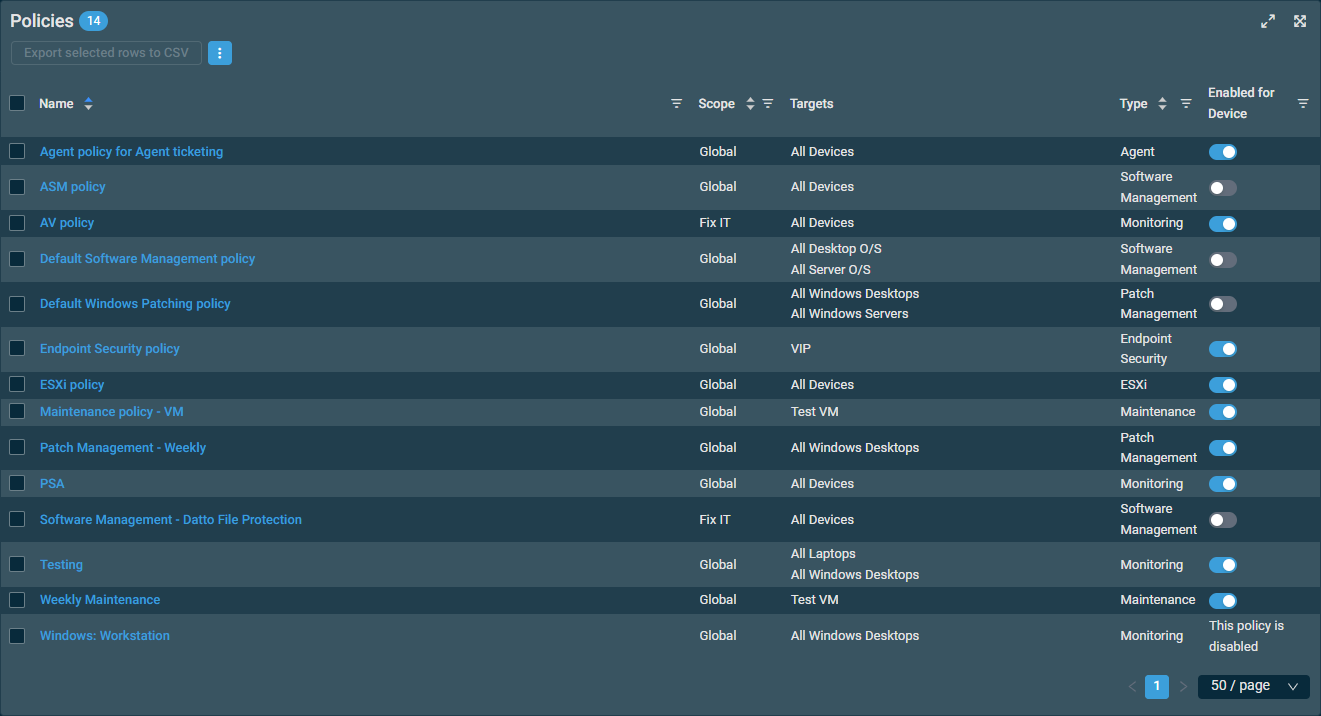
Action buttons
The action buttons are unavailable if no row is selected or if the action is not applicable to the selected rows. The check boxes allow you to select one or more rows. Select all rows shown on the page by selecting the check box in the table header. To access all action buttons, click the Row Actions icon. The table below lists all available action buttons.
Table information
The table displays the following information:
| Column | Sortable? | Description |
|---|---|---|
| Name |
|
Displays the name of the policy. To narrow the list, click the filter icon |
| Scope |
|
Displays the policy scope. To narrow the list, click the filter icon NOTE If a site-level Patch Management policy is an override of a global policy, it is indicated in the Scope column (for example: Fix IT (Override). |
| Targets | Displays the targets the policy will run against. Refer to Targets. | |
| Type |
|
Displays the policy type. To narrow the list, click the filter icon |
| Enabled for Device | Displays whether this policy is currently enabled for the device. To narrow the list, click the filter icon To enable or disable the policy from running on this device, turn the toggle within this column on or off, respectively. Users must have Manage permissions to Global > Policies to toggle enabled status. NOTE Policies that have been disabled at the global or site level cannot be enabled from within this card. |
The table density is set to condensed theme by default. To change it to relaxed theme, click the density toggle icon. ![]() The selection will persist across all pages.
The selection will persist across all pages.
The expand icon ![]() allows you to open the list in full-page mode with full functionality. By default, the page will display all results for the device. For details on the functionality available in the expanded view, refer to List of policies.
allows you to open the list in full-page mode with full functionality. By default, the page will display all results for the device. For details on the functionality available in the expanded view, refer to List of policies.
The number of results displayed can be specified by selecting the desired number from the pagination control. This selection will persist the next time the page is accessed.
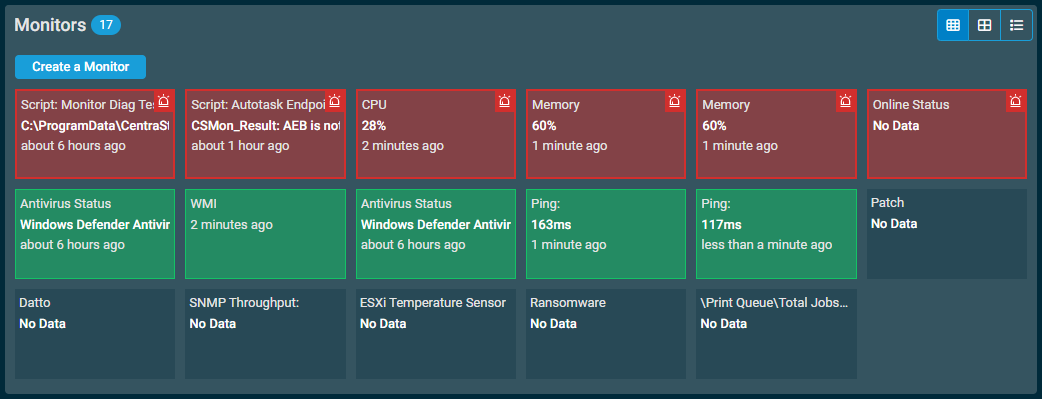
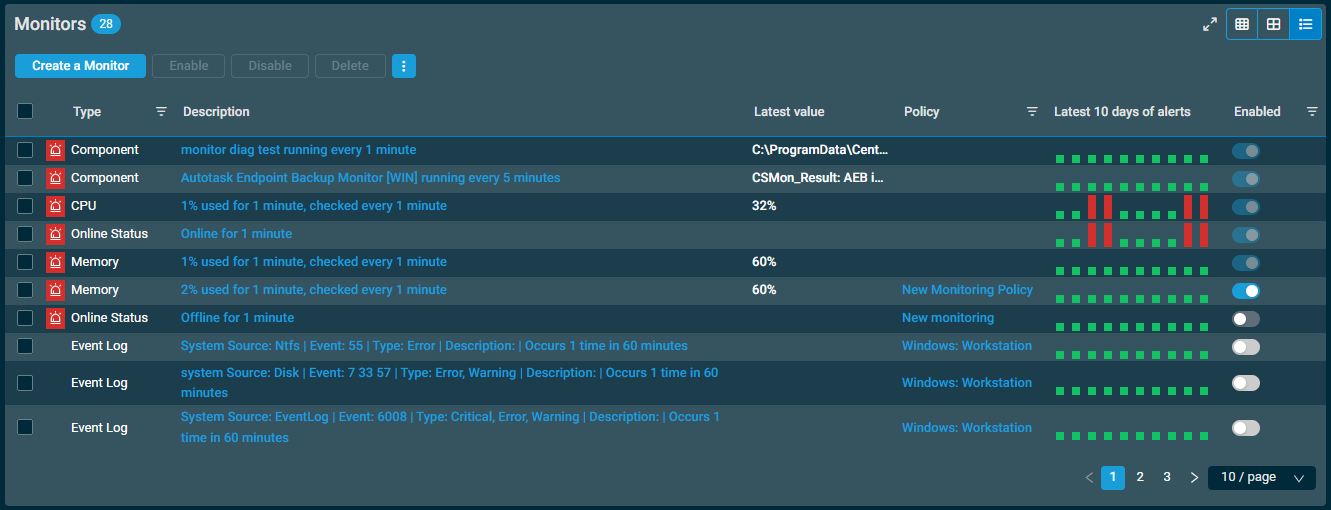
The Monitors card displays a list of the device's monitors. The card header has a badge showing the number of monitors. You can choose from the following display options: Small tiles, Large tiles, Detailed view (selected by default).
Tiles view
- Limited information is displayed: Monitor Type, Latest Value, the View Alert icon, and the time of the last reading.
- Only active (enabled) monitors are shown.
- Allows you to create a monitor. Refer to Creating a monitor.
Detailed view
- Detailed information is displayed. Refer to Table information (detailed view).
- Both active (enabled) and disabled monitors are listed. The rows are displayed in the following order: alerting monitors, enabled but not alerting monitors, disabled monitors.
- Allows you to create a monitor. Refer to Creating a monitor. Various other table actions are also available. Refer to Action buttons (detailed view).
-
The number of results displayed can be specified by selecting the desired number from the pagination control. This selection will persist the next time the page is accessed.
Action buttons (detailed view)
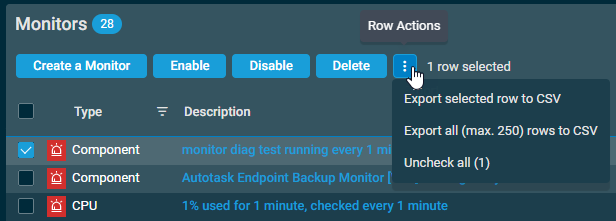
The action buttons are unavailable if no row is selected or if the action is not applicable to the selected rows. The check boxes allow you to select one or more rows. Select all rows shown on the page by selecting the check box in the table header. To access all action buttons, click the Row Actions icon. The table below lists all available action buttons.
| Action Button | Description |
|---|---|
| Create a Monitor | This action is available without selecting any row in the table. Refer to Creating a monitor. |
| Enable | Enables/disables the monitor upon confirmation. This is only available for monitors within policies. SNMP monitors: if a monitor has an instance, enabling/disabling the monitor will enable/disable the parent monitor and all related instance monitors. |
| Disable | |
| Delete | Deletes the selected monitors upon confirmation. This is only available for standalone monitors. SNMP monitors: if a monitor has an instance, this action will delete the parent monitor. |
| Export Selected Rows to CSV | In the confirmation dialog box, select whether to show table headers in the file by toggling the Show table headers in the exported CSV button. Click Confirm to download the file. Any column selections, filters, and sorting that have been applied to the table will also be applied in the CSV file. A maximum number of 500 rows can be exported to a single CSV file. The Export All (Max. 500) Rows to CSV action is available without selecting any row in the table. |
| Export All (Max. 500) Rows to CSV | |
| Uncheck All | Clears all selected rows. The number of selected rows is indicated next to the Row Actions icon. |
Table information (detailed view)
| Field | Description |
|---|---|
| View Alert | The alert icon indicates that the monitor is currently in an alerting state. Click the icon to see the most recent alert raised by the monitor. Refer to Single Alert View. |
| Type | Displays the monitor type. Click the filter icon 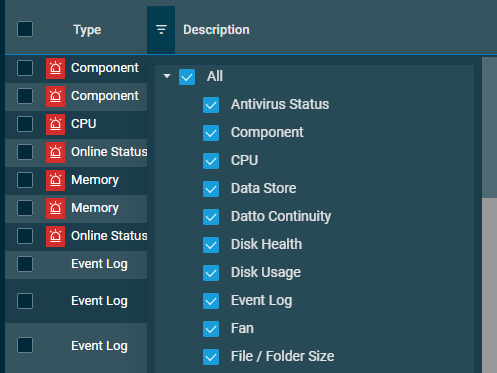 |
| Description | Displays the parameters specified in the monitor. Refer to Alert details per monitor type. SNMP monitors: when data is available, the instance names are added to the description. Click the description of a monitor to see its details. Refer to Viewing monitor details. |
| Latest Value | Displays the latest measured value. A warning is displayed if the monitor will not work for this device. Hover over the latest value to see when the data was received. The Agent will only send data when the monitor result changes or one hour has passed since the last reading. NOTE Any Drive Disk Usage monitor will only show value for a drive that is closest to the threshold set within the monitor. Refer to Disk Usage monitor. NOTE ESXi Data Store monitor will only show the datastore that is closest to the threshold set within the monitor. Refer to ESXi Data Store monitor. NOTE Real-time monitoring metrics are stored for seven days and up to a maximum of 60 metrics. If no data is received in seven days (for example, the device goes offline), the Latest Value field will be blank in detailed view, or display No Data in either of the tile views. This field always shows as blank or No Data for the following monitor types: Datto Continuity, Event Log, Online Status, Ransomware, and Patch. |
| Policy | Displays the name of the policy that the monitor is part of. This field is empty for standalone monitors. Click the policy name to see and update the policy details. Refer to Policies. To narrow the list, click the filter icon 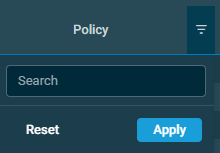 |
| Latest 10 Days of Alerts | Displays if the monitor raised an alert in the last 10 days. Hover over the bars to see the dates. The alert status is displayed the following way: • Short, green bars: no alert was raised. • Tall, red bars: the monitor raised at least one alert. Click the bar to see the most recent alert raised on that day. Refer to Single Alert View. 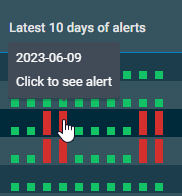 |
| Enabled | Refer to Enable. Click the filter icon |
The table density is set to condensed theme by default. To change it to relaxed theme, click the density toggle icon. ![]() The selection will persist across all pages.
The selection will persist across all pages.
The number of results displayed can be specified by selecting the desired number from the pagination control. This selection will persist the next time the page is accessed.
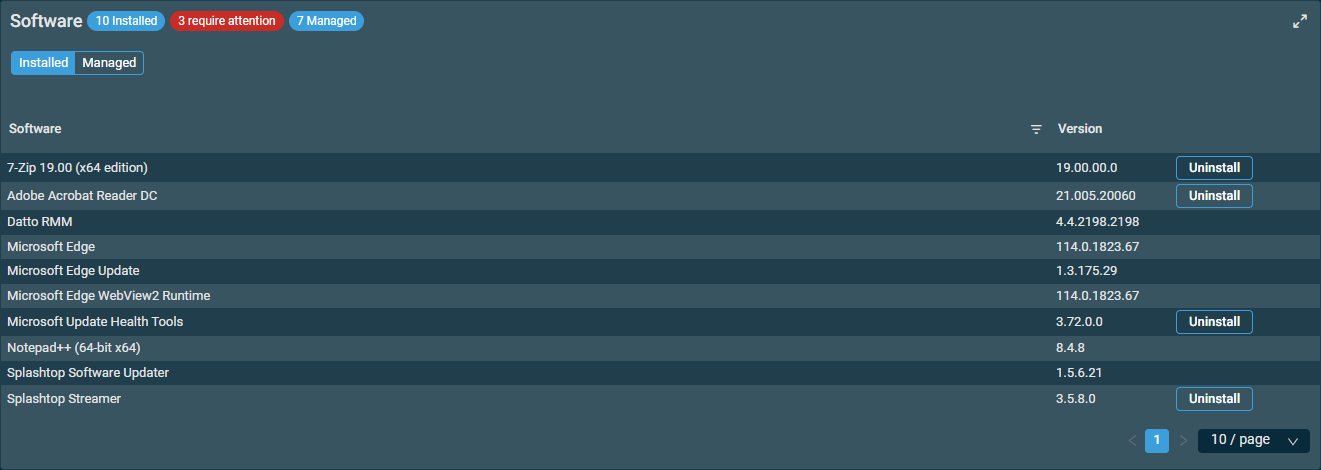
The Software card allows you to toggle between Installed and Managed software for the device. The card header also shows the total number of applications that are Installed, Managed, or that require attention.
A Software Management policy must be targeting the device in order for Managed software to be displayed. Refer to Software Management and Advanced Software Management. Click the hyperlinked policy to view the policy details. Refer to Software Management policy. 
If no Software Management policy is currently targeting the device, a message will indicate this when the Managed toggle is selected.
NOTE You must have at least View access to Global > Policies or Sites > Policies to view Managed software. Refer to Permissions.
You must also have at least View access to Global > Manage or Sites > Manage to view Software Management policies targeting the device. Refer to Permissions.
IMPORTANT Multiple global (account-level) and site-level Software Management policies can be enabled at a time, but only one Software Management policy can be enabled per device at a time. If an additional Software Management policy is configured to target a device that already has a Software Management policy enabled, the additional policy will be automatically disabled at the device level.
You can change the Software Management policy enabled on the device by clicking Change Policy. Select a different policy from the list, then click Confirm. The originally selected policy will be disabled from running on the device.
When the Installed toggle is selected, the software table contains the following information:
| Column | Description |
|---|---|
| Software | Displays the name of the software application. To narrow the list, click the filter icon  |
| Version | Displays the version number of the software application. |
| Uninstall | This button appears in the table for all Windows software with an MSI uninstaller. Click the Uninstall button. Click Confirm to execute the action or Cancel to close out of the dialog box. The software will be uninstalled from the device upon confirmation. NOTE You must have permissions to run quick jobs. Refer to Quick jobs. Once clicked, the button displays Uninstalling and a quick job is created that will uninstall the software. The quick job is visible on the Activities card. Refer to Activities. NOTE If the job is deleted or canceled before it runs, the software will no longer be flagged for uninstallation, and the button will once again display Uninstall. Once the uninstall process has completed successfully and the software has been removed from the device, the software will no longer appear under Installed in the Software card once the page is refreshed. Details about the uninstalled software are viewable in the StdOut. Refer to Activity Details. If you wish to mass-uninstall software on multiple devices at once via an immediate job, refer to the Uninstall option available on the global and site-level Software page. Refer to Column Chooser - Software. |
When the Managed toggle is selected, the software table contains the following information:
| Column | Description |
|---|---|
| Name | Displays the Managed software applications included in a Software Management policy targeting the device. |
| Installed Version | Displays the version number of the software application. If the application is not installed on the device, this field will be empty. |
| Latest Version | Displays the latest available version of the software application.
NOTE The Latest Version field for Bitdefender, Microsoft Teams, and Webroot SecureAnywhere is static and does not change. Datto RMM Software Management is only concerned with deployment for these applications; once installed, the applications will update themselves without Software Management's involvement. |
| Action | Displays the action selected for the software application in the Software Management policy. Refer to Software or Advanced Software in Software Management policy. The Approve button allows you to approve the update for the Managed application on the device. This action is available only if the software status for that particular type and version of software on the device is non-compliant and approval is required. This occurs once a software update becomes available and either Manually approve or Manually approve and install if not present is selected for that application within the policy. In the confirmation dialog box that appears, click Confirm to manually approve the software update or Cancel to close out of the dialog box. Clicking Confirm will cause the Status of the device to change to Compliant for that application once the action is executed. This action adheres to the deployment window scheduled in the policy. Refer to Timing in Software Management policy. 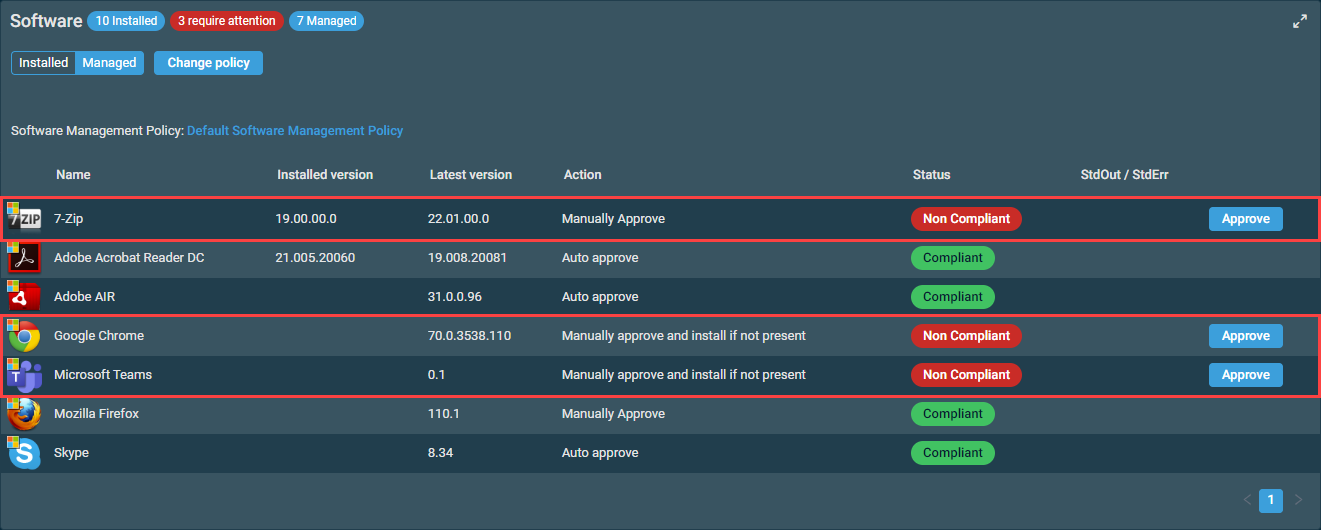 NOTE You must have Manage access to Sites > Devices. Refer to Permissions. |
| Status |
Displays one of the following software compliance statuses:
|
| StdOut / StdErr | Click the link to view the standard output or standard error results file, if available. |
The table density is set to condensed theme by default. To change it to relaxed theme, click the density toggle icon. ![]() The selection will persist across all pages.
The selection will persist across all pages.
The number of results displayed can be specified by selecting the desired number from the pagination control. This selection will persist the next time the page is accessed.
NOTE Lists of software and hardware installed on devices, as logged by the Datto RMM Agent, are available at the global and site levels. Refer to Software and Hardware.
The Hardware card contains the following information:
| Field | Note |
|---|---|
| Manufacturer | |
| Model | |
| Warranty Expiration |
This field displays the date the device's warranty expires or is blank if no date is set. If the date is in the past, the word Expired is highlighted in red underneath the date. This field is not populated automatically. Click in the field to update the date. Enter the date manually (YYYY-MM-DD) or choose it from the calendar. The change is saved automatically. NOTE Alternatively, you may consider using a third-party integration to populate this field. NOTE If the Autotask Integration is enabled, manual edits to the Warranty Expiration date will be synchronized to Autotask; however, removing the Warranty Expiration date in Datto RMM will not be synchronized to Autotask. If the Warranty Expiration date in Datto RMM is edited through an automatic method (for example, via a third-party integration), the change will only be synchronized if the Warranty Expiration field is empty in Autotask. NOTE If the ConnectWise PSA Integration is enabled, the Warranty Expiration date will only be synchronized to ConnectWise PSA if it is not in ConnectWise PSA at the time of the initial synchronization. If a Warranty Expiration date has already been set within ConnectWise PSA, it will not be updated upon subsequent device synchronization with Datto RMM. |
| Service / Asset Tag | |
| Processor | The information includes the name, speed, and total cores of the processor. |
| Total CPU Sockets | |
| Total Free CPU Sockets | |
| Snapshots |
NOTE Lists of software and hardware installed on devices, as logged by the Datto RMM Agent, are available at the global and site levels. Refer to Software and Hardware.
The Storage card displays different information depending on the device type.
| Field | Server/Laptop/Desktop | ESXi | Description |
|---|---|---|---|
| Name of Storage |
|
|
|
| Description: Drive Type |
|
The description and type of the drive (for example, Local Disk: Local Fixed Disk). | |
| Capacity |
|
|
A graph displaying how much disk space is in use and remaining in each storage (for example, 14.3 GB - 58% in use, 10.6 GB - 42% remaining / 24.9 GB). The bar turns red when the drive has reached 70% of its capacity. NOTE The free disk space calculation Datto RMM uses for macOS devices differs from Apple's approach. Therefore, the number shown in the Storage card is different from what is shown on a macOS device. The Datto RMM Agent sends the information about the number of free bytes to the platform, and the platform divides that by 1024*1024*1024 to get a number in GB. Apple, however, divides the same number of free bytes by 1000*1000*1000 to get a number in GiB. |
| Status |
|
||
| Extent |
|
Displays the number of extents on the storage. Click the hyperlink to expand the section. NOTE Limited information is displayed if the virtual machine doesn't have a Datto RMM Agent installed. For the Hostname and Status columns to be populated, ESXi guests require an RMM Agent to be installed from the same site the ESXi host and Network Node reside in. NOTE * Potential Size being smaller than Current Size can happen in rare or unexpected conditions, that will require local environment inspection for reasoning. This can happen when a disk was provisioned with a size that has been exceeded by snapshots or other files, from out of date disk configuration information after a resize, or linked clones/snapshots inflating the Current Size value, among other reasons. |
The size calculations used to determine Current Size and Potential Size will differ depending on if reporting on virtual disk size or extra files. Refer to the table below for details.
| Storage Type | Current Size Calculation | Potential Size Calculation |
|---|---|---|
| Virtual disk | Actual used space (sum of VMDK file sizes on disk). | Configured maximum size of the datastore. |
| Extra files | Committed space minus disk usage. | Same calculation as Current Size (cannot be predicted). |
The Hyper-V Guests card displays a list of the device's guest virtual machines. This card is only displayed for Hyper-V-enabled devices.
The table contains the following information:
| Column | Sortable? | Note |
|---|---|---|
| Hostname |
|
Click the hyperlink to open the virtual machine's device summary page. No hyperlink is displayed for devices that are not added to Datto RMM. |
| Status | ||
| Guest Name |
|
|
| Operating System |
|
NOTE Limited information is displayed if the virtual machine doesn't have a Datto RMM Agent installed. For the Hostname and Status columns to be populated, ESXi guests require an RMM Agent to be installed from the same site the ESXi host and Network Node reside in.
The table density is set to condensed theme by default. To change it to relaxed theme, click the density toggle icon. ![]() The selection will persist across all pages.
The selection will persist across all pages.
The Related Devices card can display:
- Datto Networking devices that are mapped to the same site a device is associated with.
- The Network Node that is assigned to the device.
- The ESXi host of the device.
- The Hyper-V host of the device.
NOTE These devices are only displayed if the Datto Networking Integration is enabled AND this device is in a site that is mapped to a Datto Networking network. For information about the integration, refer to Datto Networking Integration.
NOTE Datto Managed Power devices must be manually linked to Datto RMM or Datto Continuity devices. Refer to Ports (Datto Managed Power).
The card contains the following information:
| Field | Description |
|---|---|
| Icon | Displays the device type icon of the related device. |
| Device Type | Displays the device type of the related device. This field also provides information about the relationship between the two devices, for example, Powered by Datto Managed Power or Connected to Datto Switch. |
| Last Seen | Displays when the related device was last seen. This information is not displayed for Datto Managed Power devices. |
| Status | Green circle - The related device is online. Transparent circle - The related device is offline. |
| Hyperlink | Click the hyperlink to open the related device's device summary page. |
The Protected Devices card is only displayed for Datto Continuity devices if the Datto Continuity Integration is enabled and a Datto RMM device is being protected by this Datto Continuity device. Refer to Datto Continuity Integration.
NOTE A Datto Continuity device reports a list of Agents, which is checked against devices in Datto RMM. Protected devices are then mapped only if both the hostname and IP address match. Protected devices in the same site that share both the same hostname and the same IP address are not supported by this integration.
If the protected device uses agent-based monitoring and management technology, also has a Datto RMM Agent installed, and resides in the same Datto RMM site as the mapped Datto Continuity device that is protecting it, a link to the device is provided. Refer to Hostname.
For lists of greater than 10 devices, the number of results displayed on one page can be specified at the bottom of the table. You can choose 10/20/50/100 results per page.
The card provides a summary of the backup status of all protected devices, and contains the following information:
| Field | Description |
|---|---|
| Status | The status of the protected device, as follows:
NOTE API records of agentless protected devices do not contain an IP address (only a hostname). Therefore, agentless devices, even if they have the Datto RMM Agent installed, will show the Unmanaged status and will not include a link to the device in the Hostname column. |
| Hostname | The name of the protected device. Click the link to view the device summary page for the protected device. If there are multiple protected devices with the same hostname on the account (in the same site or different sites), these devices are included in the list. |
| Last 10 Backups | The status of the last 10 backups. Hover over the bars to see the dates. The backup status is displayed the following way: • Short, gray outlined bars: no backup was completed. • Short, green bars: the backup was successful. • Medium, yellow bars: the backup completed with warnings or errors. • Tall, red bars: the backup failed. Click the bar to see additional details about the reason for failure. |
| Local Backup | The last time the protected device was backed up. |
| Screenshot Verification | The last time a screenshot was taken of the protected device. |
| Offsite Sync | The last time the protected device was synced. |
| Unprotected Volumes | The number of volumes on the protected device that are not currently being backed up. |
| Agent Status | Paused will appear in this field if the agent on the protected device has been paused. For additional resources, search the Kaseya Helpdesk. Archived will appear if the agent on the protected device has been archived. For additional resources, search the Kaseya Helpdesk. |
The table density is set to condensed theme by default. To change it to relaxed theme, click the density toggle icon. ![]() The selection will persist across all pages.
The selection will persist across all pages.
The Datto Continuity card is only displayed if the Datto Continuity Integration is enabled and the Datto RMM device is protected by a Datto Continuity device. Refer to Datto Continuity Integration.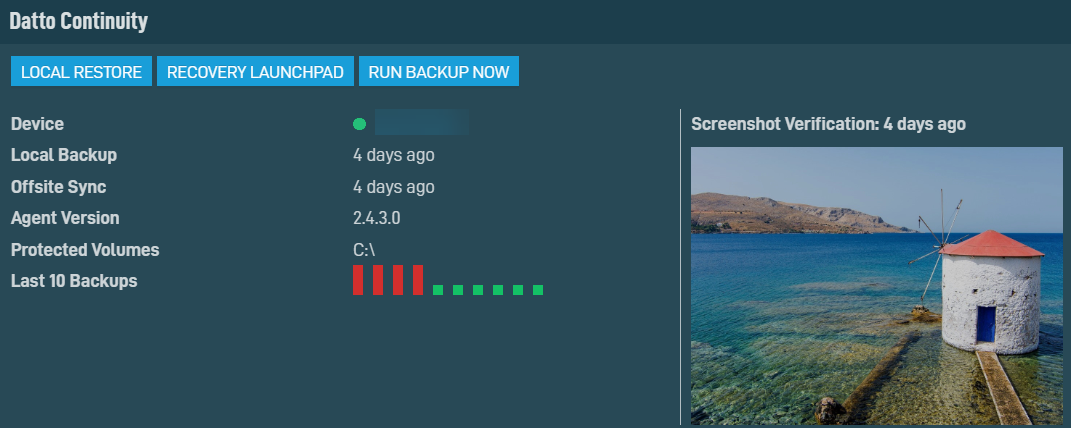
The table below lists all available action buttons.
| Action Button | Description |
|---|---|
| Local Restore | Initiate a local restore of the Datto RMM device that is protected by this Datto Continuity device.
Only available when the Datto Continuity device is online. The system and recovery type will be preselected. Choose a recovery point for the device and click Start Restore. For additional resources, search the Kaseya Helpdesk. NOTE This field is not displayed for devices protected by Datto Backup for Microsoft Azure or Datto Endpoint Backup with Disaster Recovery devices. |
| Recovery Launchpad | Access the Recovery Launchpad, where you can configure the restore method for devices. For additional resources, search the Kaseya Helpdesk. |
| Run Backup Now | Run a backup immediately for this device. Only available when the Datto Continuity device is online. The Backup Agents page will be pre-filtered by the selected Agent. For additional resources, search the Kaseya Helpdesk. NOTE This field is not displayed for devices protected by Datto Backup for Microsoft Azure or Datto Endpoint Backup with Disaster Recovery devices. |
The card contains the following information:
| Field | Description |
|---|---|
| Device | A link to the device summary page for the Datto Continuity device that is protecting this device. The link also shows whether the device is online or offline. |
| Local Backup | The last time this device was backed up. |
| Offsite Sync | The last time this device was synced. |
| Agent Version | The version of the Datto Windows Agent running on this device. |
| Agent Status | If backups are paused for this device, this field is visible and Paused appears in the field. For additional resources, search the Kaseya Helpdesk. NOTE If the agent has been archived for this device, the Datto Continuity card will not display for this device. |
| Protected Volumes | The drives on this device that are currently protected by the associated Datto Continuity device. |
| Last 10 Backups | A visual representation of the last 10 backups run on this device. Refer to Last 10 Backups. |
| Screenshot Verification | The last screenshot taken on this device and the time the screenshot was taken. |
The Activities card displays a list of device activities of the last 180 days.
NOTE Job results older than six months are automatically cleared.
The table below lists all available action buttons.
| Action Button | Description |
|---|---|
| Activity Log | Opens the Activity Log page specific to this device. Refer to Activity Log. |
The following information is displayed:
| Field | Description |
|---|---|
| When? | Displays how long ago the activity was performed. |
| Activity Type |
Hover over the icon to see what kind of activity was performed. The card displays the following activities: |
| Activity Details | Displays the name and various details of the activity, such as who initiated it, when it was performed, and its status. Activities successfully carried out are highlighted in green, while failed activities are highlighted in red. Job names are hyperlinked. Click the hyperlink to see more details about the job. Refer to Job results.  StdOut (standard output) and StdErr (standard error) information may be available for jobs, as well as for patch management and software management activities. Expand the StdErr or StdOut section to see more details and to download the file. The results are available to download within three months. NOTE A job output file can also be downloaded from within an email notification if the job was configured to send an email. Refer to Automatically Email StdOut/StdErr Options in Scheduled jobs, or StdOut/StdErr in Job results |
The Network card displays different information depending on the device type.
| Field/Column | Sortable? | Server/Laptop/Desktop | ESXi |
|---|---|---|---|
| External IP |
|
|
|
| Internal IP |
|
||
| Adapter Name |
|
|
|
| IP |
|
|
|
| Speed |
|
||
| MAC Address |
|
|
The table density is set to condensed theme by default. To change it to relaxed theme, click the density toggle icon. ![]() The selection will persist across all pages.
The selection will persist across all pages.
The Metrics card displays up to 90 days of device metrics for Agent-based devices. These long-term device metrics can help you improve troubleshooting and capacity planning.
Hover over the Select metrics to show or hide icon and choose any of the following options. The graphs are automatically refreshed when any of the options are added or removed.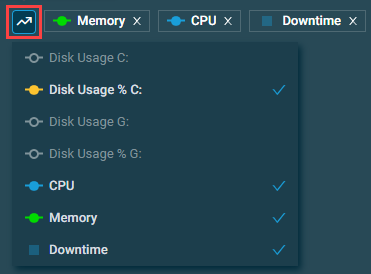
- Disk Usage: Only displayed for Windows devices.
- Disk Usage %: Only displayed for Windows devices and selected by default. If multiple drives are available, the C drive is selected by default.
- CPU: Selected by default.
- Memory: Selected by default.
- Downtime: Selected by default.
The times and dates in this card reflect the user time zone configured on the Setup > My Settings page. Refer to User Time Zone.
The Metrics card displays the following information:
| Field | Description |
|---|---|
| Usage/Utilization | Displays usage data of the selected metrics for the selected date range. Hover over anywhere in the CPU, Memory, or Disk Usage graphs to see metric names and exact data at any given point in time. To view predefined and custom date ranges, refer to Date Range. • Disk Usage: Orange line and icon in dark mode or red line and icon in light mode. This metric displays disk usage data (number of gigabytes (GB) used) for local fixed disks on Windows devices. • Disk Usage %: Yellow line and icon. This metric displays disk usage percentage data (percentage (%) of disk used) for local fixed disks on Windows devices. NOTE Optical, network, and removable drives are excluded from Disk Usage metrics. NOTE A and B drives were historically reserved for floppy drives. This means that for compatibility reasons, Windows devices leave these drive letters reserved, while not typically using them. As such, in Datto RMM, metrics for these drive letters are not monitored or displayed. • CPU: Blue line and icon. This metric displays CPU usage data. NOTE If only one metric is available for a metric type (for example, CPU in the screenshot below), the graph will display a solid line and a full circle icon. If multiple metrics are available for the same metric type (for example, Disk Usage and Disk Usage % in the screenshot below), the graph will display a solid line and a full circle icon for one of the metrics and dashed lines and hollow circle icons for the rest of the metrics of the same type. For example, in the screenshot below, Disk Usage C uses a solid orange line and a full orange circle, while Disk Usage D uses a dashed orange line and a hollow orange circle. NOTE Datto RMM measures the CPU metric using the following performance counter: \Processor Information(_Total)\% Processor Time. Task Manager on Windows 8 and later, on the other hand, uses Processor Information(_Total)\% Processor Utility. Therefore, you may see a discrepancy between the CPU usage displayed in the Datto RMM web interface and the CPU usage shown in the device's Task Manager. "The difference between the two counter types concerns how they measure the actual work that the processor performs. The time-based performance counters measure the percentage of time that the processor is busy, whereas the utility performance counters measure how much work the processor actually performs." (Source: Microsoft.) Additional information on some noted problems in the adoption of utility performance counters in Task Manager can be found in this article. |
| Downtime |
IMPORTANT To register downtime correctly on Linux devices, make sure to set "storage=persistent" in the /etc/systemd/journald.conf file and restart journalctl via "systemctl restart systemd-journald". Hover over the Downtime graph (blue rectangle) to see for how long a device was down, including start/end date and time. NOTE Downtime includes periods when the device is shut down or when it is in a sleep or hibernation state. However, it does not include periods of network connectivity issues or Datto RMM Agent downtime. When the Downtime metric is selected in the metric selector, a summary of the total uptime and downtime for the selected date range is also displayed below the graphs (for example, "Uptime for period: 8 hrs (36.6667%) | Downtime for period: 15 hrs (63.3333%)"). The Datto RMM Agent reports device downtime to the platform at different intervals based on operating system. These intervals are as follows: NOTE If the Datto RMM Agent has not yet sent the latest updates to the platform, the Downtime graph may be missing, or there may be gaps between metrics. You may also notice that the uptime/downtime summaries below the graphs may be slightly inaccurate. |
| Date Range | Custom date ranges:
You can specify a custom date range using one of the following options: • Click the calendar field to select a custom start/end date and time, and then click OK. 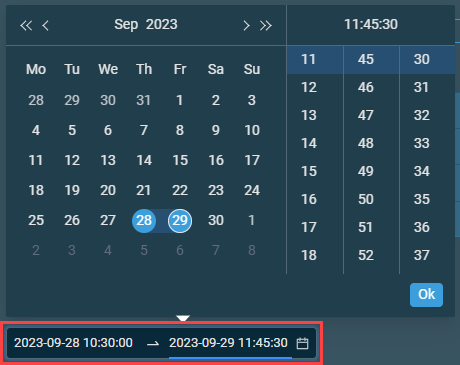 • Hover over a metric and click the metric icon at a time stamp to start zooming into a custom date range. Click another time stamp to specify the end of the date range. 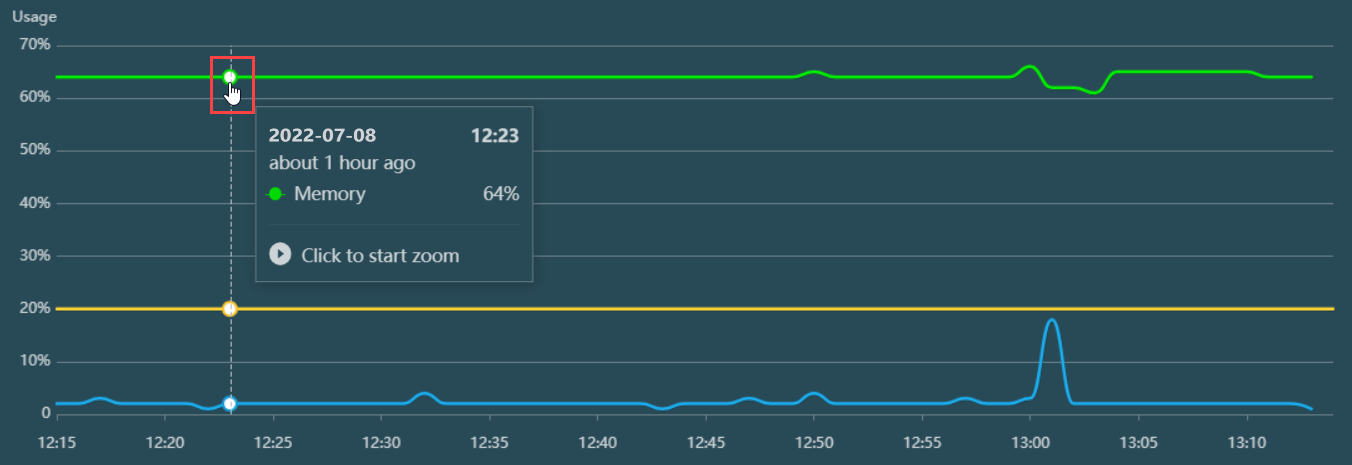 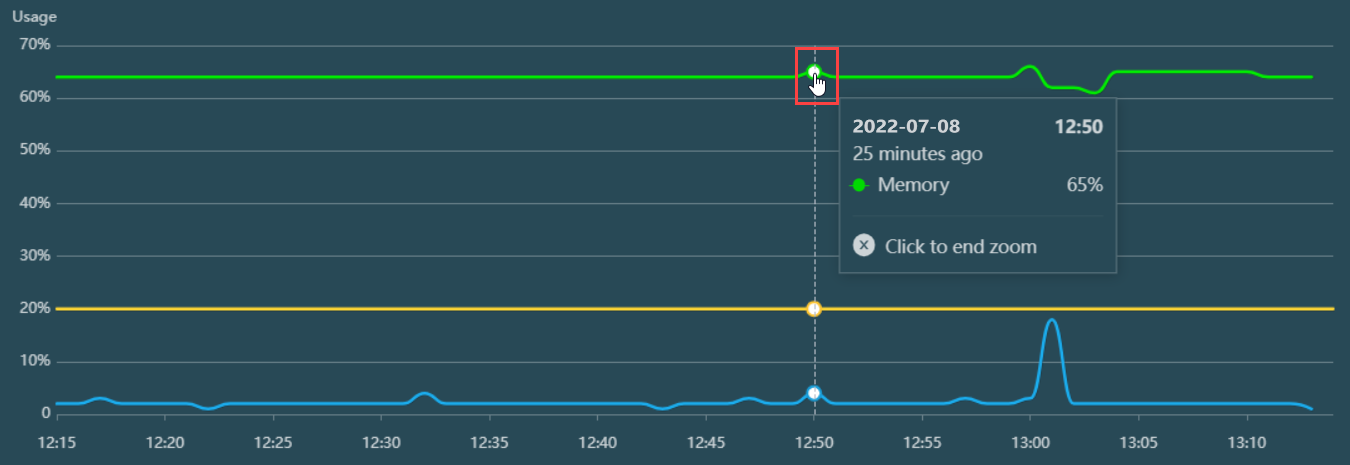 Predefined date ranges: NOTE The Custom button only becomes active if a custom date range is used; however, the button is not clickable. Metrics data polling occurs every 60 seconds. When a predefined date range is used, the graphs are automatically refreshed. When a custom date range is used, the graphs only display the specified date range and are not automatically refreshed. The date and time when the metrics data was last updated is displayed below the graphs. NOTE The selected date range will persist across all devices for the logged-in user. NOTE Metrics for newly added devices become visible once policy memberships have been recalculated for the account. Refer to Policy membership recalculation. |
| Reset | Resets the current view to the default values. NOTE If a custom date range has been set using the zoom option (refer to Date Range), the Reset button will reset the graphs to the view prior to performing the zoom action. Only one level of resetting is possible. If you wish to reset the view to the default values, first select a predefined date range or a custom date range using the calendar and then click Reset. |
| Export | Hover over the Export button and select one of the following options: • PNG: Creates a PNG file of the current view including metric names. • JSON: Creates a JSON file of the current view including device ID information, metric names, disk names (when applicable), and metric data points (date and time in UTC time zone, and value). The exported file name contains the following information: Datto device metrics, device ID, hostname, device type, start/end date and time in user time zone. End date and time information is only added to the file name if a custom date range has been selected. NOTE If no metric is selected or no metric has been recorded for the selected date range, the Export button will be disabled. |
The table density is set to condensed theme by default. To change it to relaxed theme, click the density toggle icon. ![]() The selection will persist across all pages.
The selection will persist across all pages.
The Notes card displays all notes that have been added to the device. The table contains the following information:
| Column | Description |
|---|---|
| Name | Displays the note. The oldest note is displayed first. |
| Created / Updated | Displays when the note was last updated. |
The table density is set to condensed theme by default. To change it to relaxed theme, click the density toggle icon. ![]() The selection will persist across all pages.
The selection will persist across all pages.
To manually enter or update notes, follow these steps:
- To add a note, click Add a note and enter the information. The note is saved automatically.
- To update an existing note, click in the field and update the note. The change is saved automatically.
- To delete a note, click the delete icon
 . Click Confirm to execute the action or Cancel close out of the dialog box.
Notes are recorded in the Activities card and the Device Activity report. Note creation, updates, and deletion are recorded in the Activity Log.
TIP Notes have a limit of 65,534 characters.
TIP You can also add a note to the device through the Agent Browser. Refer to Notes.
IMPORTANT We recommend that you do not store credentials or other sensitive/confidential information in UDFs as the information contained in these fields is visible in plain text.
The User-Defined Fields (UDFs) card displays user-defined fields with their Default Label as defined in the User-Defined Fields section in Global Settings.
UDFs with custom labels are displayed first, with other UDFs displayed in numerical order after.
IMPORTANT UDF 1 is set to display device isolation status when using the standalone Datto RMM Ransomware Detection, and will overwrite any other data stored in that UDF. Refer to Standalone Datto RMM Ransomware Detection.
The table density is set to condensed theme by default. To change it to relaxed theme, click the density toggle icon. ![]() The selection will persist across all pages.
The selection will persist across all pages.
To manually enter or update UDF information, follow these steps:
- First, navigate to the page that the UDF is on, or expand the number of UDFs displayed per page so it is showing.
- Enter the required information to the Assigned Value column for that UDF.

NOTE UDFs have a limit of 255 characters.
NOTE UDF labels have a limit of 22 characters.
- To update an already populated UDF, click in the field and edit the information. The change is saved automatically.
- To delete any of the UDFs, click in the field and delete the information. The page will refresh automatically and the UDF will no longer be displayed.
NOTE If a hyperlink is placed in a UDF, you can click the link icon to be directed to the link location.
To find out more about UDFs, refer to User-defined fields.
The Security card displays information about the device's security state.
Action buttons
| Action Button | Description |
|---|---|
| Isolate | The Isolate and Revert Isolation action buttons are available only for Windows devices and if standalone Ransomware Detection or Datto Endpoint Security is enabled for the Datto RMM account. Both action buttons will run a job on the device if the device is online. If you see suspicious activities on a device and have concerns, you can isolate the device from the network by clicking the Isolate button. Observe the warning dialog box that appears. When a device is isolated, it will still be able to connect to Datto RMM, and you will be able to connect to it using Web Remote. Click Isolate to execute the action or Cancel to close out of the dialog box. |
| Revert Isolation | When you are sure that it is safe for a device to re-connect to the network, click the Revert Isolation button. Observe the warning dialog box that appears. After a reboot, the device will be able to connect to the network again. Click Revert Isolation to execute the action or Cancel to close out of the dialog box.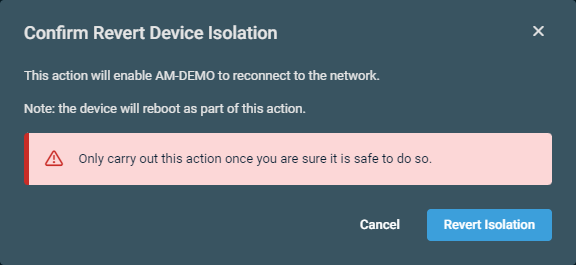 NOTE If a device is being protected by Datto EDR, there will be a link next to the Datto EDR status to revert isolation instead. Refer to Datto EDR. |
Security information
| Field | Description |
|---|---|
| Open Security Alerts/No Security Alerts | Displays the number of open security alerts for the device or No Security Alerts. The alerts are listed in alerts tables. Refer to Alerts. |
| Security Policy | Only displayed if an Endpoint Security policy targets the device. Displays the name of the active policy. Click the policy name to view or edit its details. Refer to Endpoint Security policy. If conflicting Endpoint Security policies are applied, a warning icon and tooltip are displayed. For details, refer to Endpoint Security policy.  |
| Datto Endpoint Security | |
| Datto EDR | For status descriptions, refer to Datto EDR in Endpoint Security statuses. If the device is targeted by an Endpoint Security policy with the Datto Endpoint Security configuration enabled, an external link icon is available next to the status to open Datto EDR from Datto RMM. Click to navigate to a filtered list of alerts for the device in Datto EDR. To learn about the Alerts page in Datto EDR, refer to the Alerts page topic in the Datto EDR Help system. 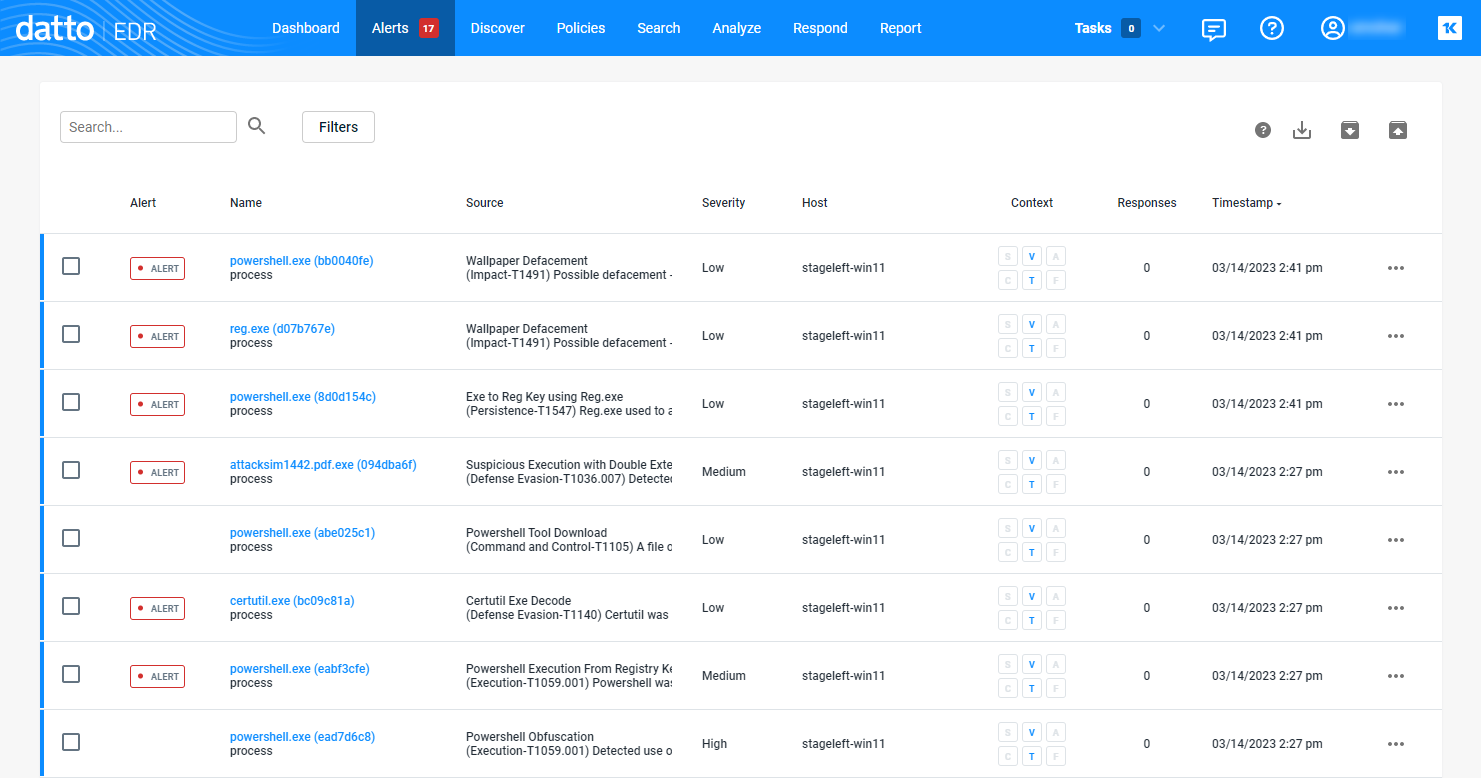 Click the drop-down menu to select an action to perform on the device. |
| Ransomware Detection | For status descriptions, refer to Ransomware Detection in Endpoint Security statuses. |
| RocketCyber | |
| RocketCyber Agent (Windows only) |
Displays the RocketCyber status. For status descriptions, refer to RocketCyber in Endpoint Security statuses. |
| Malware Protection | |
| Antivirus Product | Displays the antivirus product installed on the device. Refer to Antivirus products. For Webroot SecureAnywhere Endpoint Protection, Windows Defender Antivirus, or Bitdefender Endpoint Security Tools security products, you can leverage Datto RMM’s policy-driven Software Management technology to deploy these products to your endpoints. This includes automatic installation and reporting on widgets to review compliance. Refer to Supported software applications and operating systems. Click the drop-down menu to select an action to perform on the device. Refer to Datto AV, Webroot SecureAnywhere Endpoint Protection, Windows Defender Antivirus, or Endpoint Security.  |
| Antivirus Status | Displays the device's antivirus status. Refer to Antivirus status. The highlight legend is as follows:
|
| Managed Windows Defender/Managed Antivirus | Refer to Managed Windows Defender Antivirus in Endpoint Security statuses. Click View configuration to see more details including Latest Values and Detection History (the latter displaying up to 10 detected threats). Click Copy to copy the Managed Windows Defender Antivirus configuration details and information about the detected threats to your clipboard.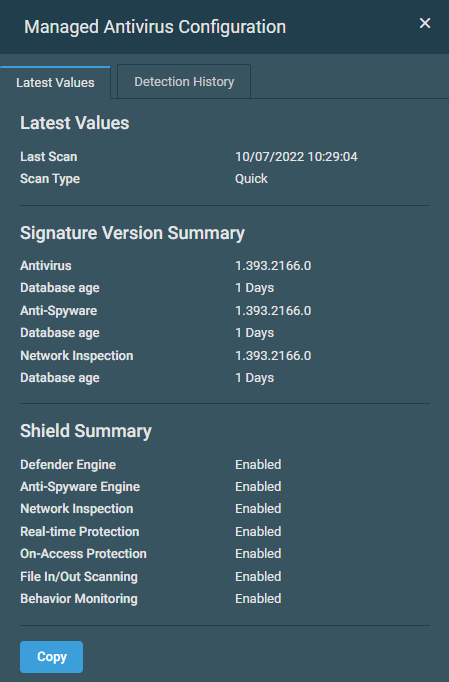 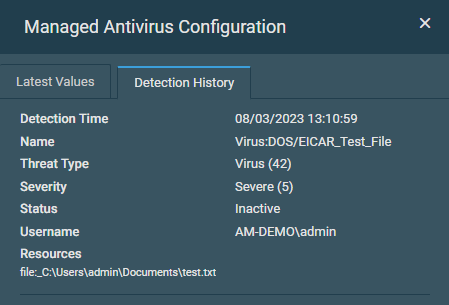 If conflicting Endpoint Security policies are applied, a warning icon and tooltip are displayed. For details, refer to Endpoint Security policy. The tab selection will persist the next time the pane is accessed. |
The Connected Devices card displays a list of devices connected to this device. The card header shows the number of connected devices in parentheses.
The table contains the following information:
| Column | Sortable? | Description |
|---|---|---|
| Last Seen |
|
Displays when the connected device was last seen. |
| Name | Displays the name of the connected device and its MAC address in parentheses. Click the hyperlink to open the connected device's device summary page. No hyperlink is displayed for devices that are not added to Datto RMM. | |
| SSID | Displays the name of the network that the connected device is on. |
The Ports card of a Datto Switch displays Datto RMM or Datto Continuity devices that are connected to the ports of the switch.
The table contains the following information:
| Column | Sortable? | Description |
|---|---|---|
| Port | Lists the ports of the Datto Switch. Green badge - One or more devices are connected to the port. Blue badge - Indicates an uplink port. Black badge - No device is connected to the port. |
|
| Description |
|
Displays the description of the port. |
| Speed/Duplex | Displays the speed and duplex settings. | |
| Connected Device(s) | Displays the name of the connected device and its MAC address in parentheses. Click the hyperlink to open the connected device's device summary page. No hyperlink is displayed for devices that are not added to Datto RMM. | |
| Enabled/Disabled | Indicates the status of the port. Click the toggle button to enable/disable the port. |
The table density is set to condensed theme by default. To change it to relaxed theme, click the density toggle icon. ![]() The selection will persist across all pages.
The selection will persist across all pages.
The Ports card of a Datto Managed Power device displays information about the ports of the Managed Power device and whether or not any Datto RMM or Datto Continuity devices are linked to these ports.
The table contains the following information:
The table density is set to condensed theme by default. To change it to relaxed theme, click the density toggle icon. ![]() The selection will persist across all pages.
The selection will persist across all pages.
The Guests card contains the following information:
| Column | Sortable? | Note |
|---|---|---|
| Hostname |
|
Click the hyperlink to open the virtual machine's device summary page. No hyperlink is displayed for devices that are not added to Datto RMM. |
| Status | ||
| Guest Name |
|
|
| Operating System |
|
|
| Data Store |
|
|
| CPU | ||
| RAM | ||
| Snapshots |
NOTE Limited information is displayed if the virtual machine doesn't have a Datto RMM Agent installed. For the Hostname and Status columns to be populated, ESXi guests require an RMM Agent to be installed from the same site the ESXi host and Network Node reside in.
The table density is set to condensed theme by default. To change it to relaxed theme, click the density toggle icon. ![]() The selection will persist across all pages.
The selection will persist across all pages.


