Main features in Datto RMM
PERMISSIONS Any user; however, access to various areas is defined by the user's security level permissions. Refer to Permissions.
Introduction
The Datto RMM web interface is built to provide a modern, security-first, scalable, and easy-to-use Unified RMM (URMM) platform for managed service providers (MSPs).

Benefits of Datto RMM
- Modern and intuitive user experience. Datto RMM provides an intuitive user experience with features such as dynamic page scaling, in-depth search capabilities, and dashboards that accurately represent what is happening within your estate.
- Enhanced security. The architecture uses a front-end API that marks a clear separation between front-end and back-end services, which enables greater platform security.
- Fast and scalable architecture for predictable performance. As the number of endpoints managed by MSPs grows, Datto RMM is processing more data than ever before. The architecture is designed for scalability, resulting in more predictable performance and enhanced responsiveness.
- Efficient workflows with quick actions and dashboards Quick actions and their interaction with components help you close tickets faster. Powerful dashboards and data visualization with widgets and granular filters that can be shared with other users help you to take insightful actions and to collaborate better for an enhanced service experience.
- Access your tools from anywhere. In an increasingly hybrid and cloud-based IT environment, Datto RMM is a seamless experience across browsers and devices, allowing you greater flexibility in servicing your clients.
- Faster time to value. Whether you are new to Datto RMM or a long-time partner adding new technicians to a growing business, the web interface is easy to learn and makes client onboarding faster with features such as network topology. Feature organization enables you to make the most out of Datto RMM’s extensive feature set.
Recently added
- Intune Quick Actions
- M365 Users widget
- Datto EDR in Endpoint Security statuses
- Device Approvals in Security levels
- Global Webhooks
- Microsoft 365 user management and Offboarding a user or revoking a user's access
Current release
Datto RMM 15.0.0 release notes
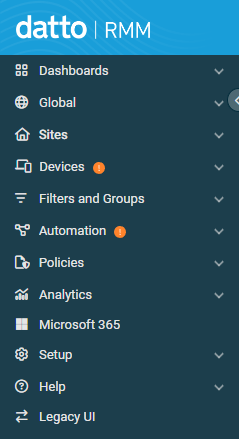
Depending on your security level, the left navigation menu provides access to the following areas. You can have several sections of the left navigation menu open simultaneously.
The header has a responsive design that will show or hide navigation items depending on the width of the window. If navigating Datto RMM in a very narrow (less than 600 pixels wide) browser window or on a mobile device, the view will be collapsed, hiding the left navigation menu and most functions of the top navigation menu.
The top navigation bar expanded:
The top navigation bar collapsed: 
The global search bar is accessible by clicking the magnifying glass icon on the right side of the search box or in the upper-right corner if viewing in the collapsed view. From here, you can enter search terms and choose which fields you want to search. For more information on searching in Datto RMM, refer to Global search.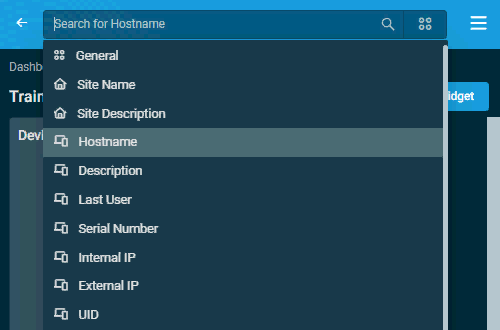
To access the top and left navigation menus in this collapsed view, click the menu icon in the upper-right corner of the header.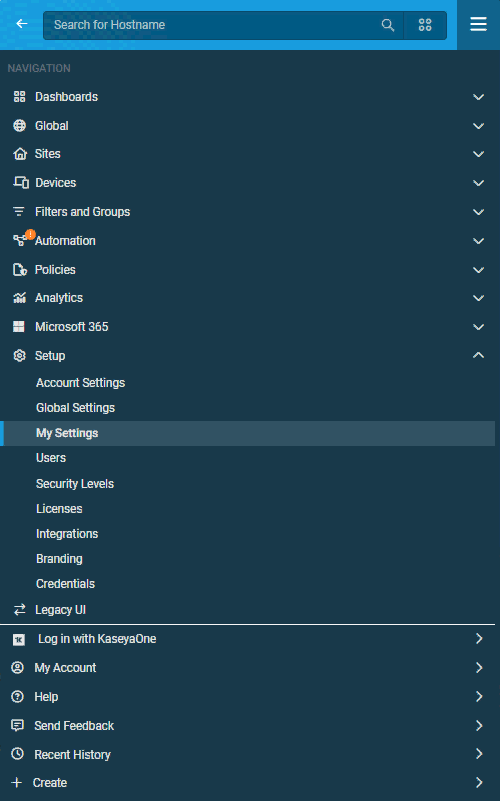
The top and left navigation menu will be condensed into one menu, with all options from both menus available.
| Area | Description |
|---|---|
| Dashboards | Refer to Dashboards. |
| Global | The Global menu provides the following summaries at the global level: Click Alerts to view the list of all alerts. Refer to Alerts. Click Filters to view the list of all device filters. Refer to Device filters. Clicking a device filter in the list will direct you to a list of devices included in that filter. Refer to View Devices. Click Groups to view the list of all Device Groups. Refer to Groups. Clicking a Device Group in the list will direct you to a list of devices included in that group. Refer to Viewing devices. Click Patches to view the list of all patches. Refer to Global and site-level patches summary lists. Click Policies to view the list of all policies. Refer to List of policies. Click Site Groups to view the list of all Site Groups. Refer to Site Groups. Clicking a Site Group in the list will direct you to a list of sites included in that Site Group. Refer to List of sites. Click Software to view the list of all software. Refer to Software. Click Software Management to view the list of Managed software. Refer to Software Management. Click Hardware to view the list of all hardware. Refer to Hardware. Click Deleted Devices to view the queue for deleted devices. Refer to Deleting a device. |
| Sites | Click All Sites to open the Sites page. Refer to Sites. Clicking a site in the list will direct you to the site summary page for that site; the selected site will also be listed in the left navigation menu, and clicking the site in the left navigation menu will also open the site summary page for the site. Refer to Site summary. Click Alerts to view the list of alerts that apply to the site. Refer to Alerts. Click Devices to view the Site Summary page for the site. Refer to Site summary. Click Filters to view the list of device filters that apply to the site. Refer to Device filters. Clicking a device filter in the list will direct you to a list of devices included in that filter. Refer to View Devices. Click Groups to view the list of Device Groups that apply to the site. Refer to Groups. Clicking a Device Group in the list will direct you to a list of devices included in that group. Refer to Viewing devices. Click Notes to view, edit, add, or delete any note for the site. Refer to Notes in Site summary. Click Patches to view the list of patches that apply to the site. Refer to Global and site-level patches summary lists. Click Policies to view the list of policies that apply to the site. Refer to List of policies. Click Network Discovery to open the Network Discovery page for this site. Refer to Networks. Click Settings to edit this site. Refer to Creating or editing a site. Click Software to view the list of software that applies to the site. Refer to Software. Click Software Management to view the list of Managed software that applies to the site. Refer to Software Management. Click Hardware to view the list of hardware that applies to the site. Refer to Hardware. Click Deleted Devices to view the queue for deleted devices within the site. Refer to Deleting a device. Click any dashboard listed in the left navigation menu to view the selected dashboard filtered for this site. Refer to Dashboards. Click Site Groups to view the list of all Site Groups. Refer to Site Groups. Clicking a Site Group in the list will direct you to a list of sites included in that Site Group. Refer to List of sites. |
| Devices | Click Device Approvals to approve or reject devices that want to connect to your account. Refer to Device approval. NOTE An ! icon next to this section indicates that there are devices requiring approval. The five most recently visited devices are displayed when this menu is expanded. Click All to open the Devices page or click an individual device to open the device summary page. Refer to Devices and Device summary. |
| Filters and Groups | Click Filters and Groups, then click Filters or Groups to access the list of device filters or groups, respectively. Clicking a filter or group in the respective list will direct you to a list of devices included in that filter or group. Refer to Device filters and Groups. |
| Automation | Click Jobs to open the Jobs Overview page. Refer to Jobs overview. Click Components to access your Component Library. Refer to Component Library. Click ComStore to access the ComStore. Refer to ComStore. NOTE An ! icon next to this section indicates that there are updates available for components in your Component Library. Refer to Update All. |
| Policies | Click Policies, then click All to see all policies. To see only one type of policy, select a policy type from under All in the left navigation menu or use a filter in the Type column on the Policies page. Refer to Policies. |
| Analytics | Click Reports to open the Reports page. Refer to Reports. Click Activity Log to open the Activity Log page. Refer to Activity Log. |
| Microsoft 365 | Refer to Microsoft 365 Integration. |
| Setup | Refer to the following topics: |
| Help | Expand the menu and click any of the help resources. Refer to Help resources. |
| < or > | Click the < icon to collapse the left navigation menu and view only the icons for each area. Click the > icon to expand the left navigation menu.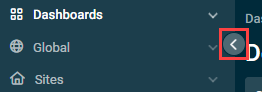 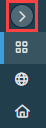 |
Refer to Logging in.
You can access your user account settings, switch between accounts, switch between security levels, or log out of Datto RMM on any page. Click your name to open a drop-down menu.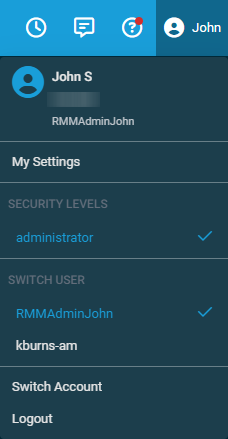
Refer to My Settings.
Click the name of the security level you want to use to change your current security level. Your current security level will have a check mark next to it. This can also be changed in the My Settings menu. Refer to Switching security levels and Current Security Level.
Click the username of the Datto RMM user account you want to switch to. A check mark is displayed next to your user account that is currently in use.
NOTE The list of users is automatically populated with all Datto RMM user accounts associated with the same email address as the currently logged in user.
Click Switch Account to launch the Datto Authweb account selection page. Click Continue next to an account to switch over to Datto Partner Portal or other Datto product pages that use the same credentials.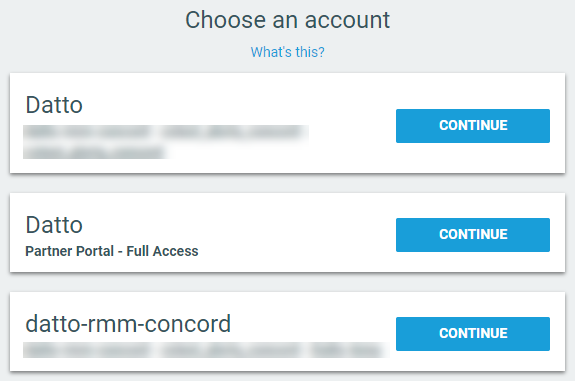
Click Logout to log out of your Datto RMM user account.
NOTE If you were logged in to Datto RMM via KaseyaOne Unified Login, you will also be logged out of KaseyaOne. Refer to Unified Login with KaseyaOne.
The Datto RMM web interface is localized in the following languages:
- English
- French
- German
- Spanish
- Italian
- Portuguese
To learn how to change the language of the interface, refer to User Language.
The global search bar is accessible at the top of any page. You can start a search by pressing the F key on your keyboard or by clicking the search bar.
Searching and search results

You can focus your search on a specific field or select the General option that allows you to search multiple fields at the same time.
- From the drop-down list, select a field you want to search on. The following fields are available:
- General: It searches all of the following fields listed except for Custom Device Filter, Default Device Filter, Device Group, and User-defined fields 1-300.
- Site Name
- Site Description
- Hostname: This field is selected by default when logging in to your account for the first time.
- Description
- Last User
- Serial Number
- Internal IP
- External IP
- UID: The unique identifier of the device, which is automatically created upon adding the device to your Datto RMM account. Refer to the UID field in the Summary card.
- Custom Device Filter
- Default Device Filter
- Device Group
- M365 User Email
- M365 User Name
- User-defined fields 1-300
- Enter any term into the search bar. The search results will be narrowed and highlighted as you type. If no result is found, it will be indicated below the search bar. Searches are not case sensitive.
- If any match is found, the following will be displayed:
- Quick results: A list of items matching your search term. Where applicable, the listed items will display some device information (device hostname, online status icon, and description) and site information (site name). In the case of filters and groups, the listed items will indicate the scope (global or site). If you search using the General option, the search results will be grouped by the supported search fields. Search fields with no results will not be displayed. Click any item in the quick search results.
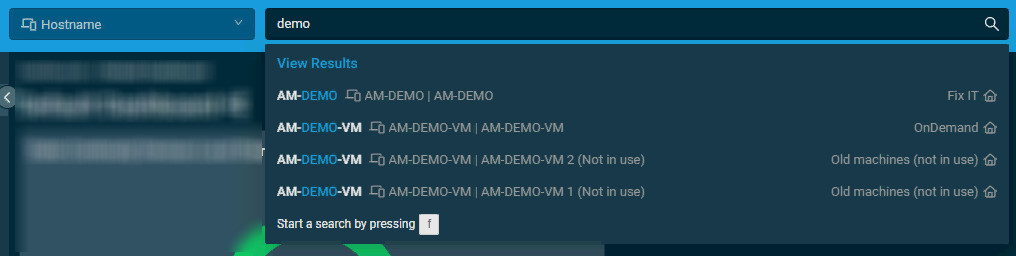
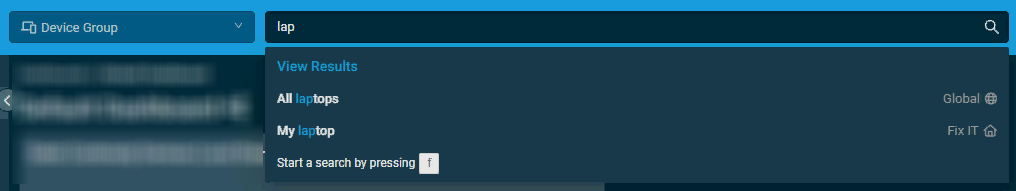
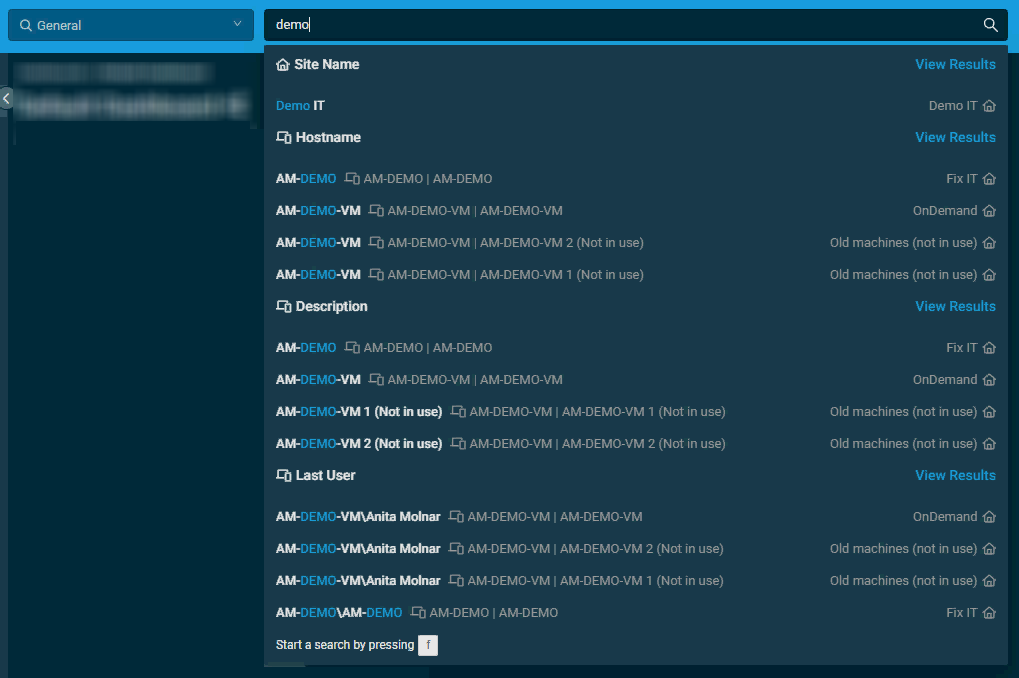
- All results: Press Enter on your keyboard or click the View Results link above the list of quick results to open a full list of items filtered by your search term within a specific search field. Using Enter is supported in all search fields except for General. From the filtered list, you can perform any of the available actions on that page or add more filtering as required. You can also select a different search field on the page while keeping the original search term.
- Quick results: A list of items matching your search term. Where applicable, the listed items will display some device information (device hostname, online status icon, and description) and site information (site name). In the case of filters and groups, the listed items will indicate the scope (global or site). If you search using the General option, the search results will be grouped by the supported search fields. Search fields with no results will not be displayed. Click any item in the quick search results.
NOTE The Filtered by bar will display the selected search field and search term even if the column for that search field is not selected in the Column Chooser.
Notes
- The search field selection will persist across pages and between login sessions.
- You can use the arrow and Enter keys on your keyboard to change the search field focus or to select an item in the list of search results.
- When selecting a search field using either the keyboard or the mouse, the cursor will focus on the search bar.
- If a search term includes wildcard characters (for example, underscores and percent signs), they serve as normal characters if they are preceded by a backslash. For details, refer to Wildcard characters.
Clicking the Create icon opens a menu of shortcuts to the standard configuration pages inside Datto RMM. This menu respects the security level permissions of each user and hides any items the user doesn't have permission to create. The following shortcuts are available:
- Device: Refer to Adding a device.
- Site: Refer to Creating or editing a site.
- Filter: Refer to Creating a filter.
- Component: Refer to Creating a component.
- Job: Refer to Creating a job.
- Policy: Refer to Creating a policy.
- Report: Refer to Creating a report.
- User: Refer to Creating a user.
- Security Level: Refer to Creating a security level.
NOTE The Device shortcut will automatically apply the currently selected site if clicked from that site's list of devices. Refer to List of devices in a site in Devices.

Hover over the Recent History icon to the left of your name to view a list of recently accessed sites and devices. You can also right-click any item in the list to perform further actions, such as copying the link or opening it in a new tab or window.
If you have suggestions or comments about Datto RMM, click the Send Feedback icon in the upper-right corner of any page, or navigate to Help > Send Feedback. Your feedback will be sent directly to the development team and it will be used to improve the functionality of the pages and to prioritize new features.
NOTE This method sends feedback to our development team. For functionality issues that impact your day-to-day operations, submit a Kaseya Helpdesk request.
NOTE If your feedback could be considered a feature request for a future update of Datto RMM, check out our Kaseya Ideas portal. There, you can post your idea or vote for an idea already posted by another user.
Click the Help icon to access the following help resources: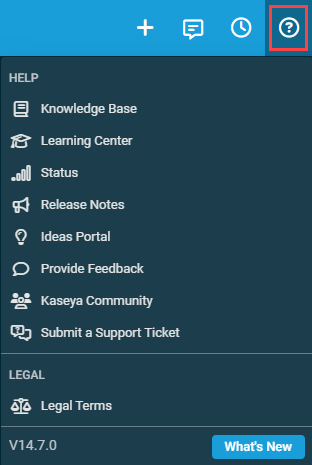
- Knowledge Base: Refer to Datto RMM Help system.
- Learning Center: Refer to Learning Center.
- Status: Refer to the Kaseya status page.
- Release Notes: Refer to Datto RMM release notes.
- Ideas Portal: Refer to the Datto RMM ideas portal.
- Provide Feedback: Refer to Sending feedback.
- Kaseya Community: Refer to Kaseya Community.
- Submit a Support Ticket: Refer to Support.
- Legal Terms: Refer to Kaseya Legal.
- Version Number: Displays the current version number of Datto RMM.
- What's New: Refer to Current release. A red dot on the icon indicates a new release has been deployed. The red dot will remain until you click What's New to open the latest release notes.

NOTE The version number is not displayed in the left-navigation Help menu.
Access in-product guided walkthroughs by navigating to Help > Learning Center.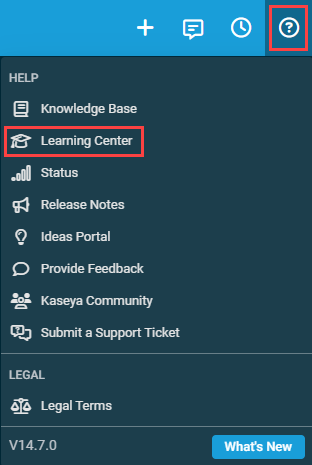
The Onboarding Tasks tab, selected by default, allows you to select individual tasks to be guided through, and tracks your progress as you are guided through these tasks directly in the web interface.
Click the Resources tab to access our full guided tours to help configure Datto RMM in general, as well as videos on our key Kaseya integrations, with resources to help you get started.
You can also type keywords in the search bar to filter for relevant resources from both tabs.
Refer to Interactive help browser requirements.
Breadcrumbs are available within page headers. Click a hyperlink in the breadcrumb path for simpler navigation back to that page.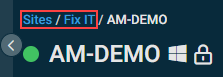
Time stamps reflect the user time zone and preferred date format configured on the Setup > My Settings page. Hovering over any time stamp will show its date in the alternative format. Refer to User Time Zone and Date Format.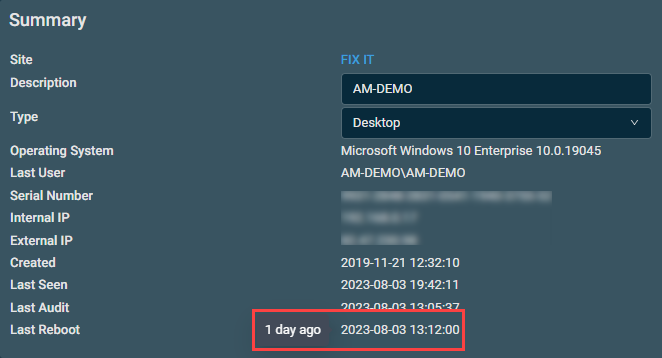
NOTE This does not apply to Bios dates or dates that are part of a string (for example, the Last edited field on the job results page).
- m key: When viewing a dashboard, it allows you to enter full-screen mode. This shortcut is only available when the dashboard contains at least one widget. Refer to Dashboards.
- f key: It activates the global search bar. Refer to Global search.
NOTE This shortcut will not work on a dashboard that is opened by default upon initially logging in. You must navigate away from the Dashboards menu and then navigate back to a dashboard for this shortcut to work.
Wildcard characters may be used in column filters and search boxes. For example, a percent sign (%) functions as a wildcard for zero or more characters, and an underscore (_) functions as a wildcard for exactly one character.
To cause wildcard characters to serve as normal characters while filtering or searching for specific results, enter a backslash (\) as an escape character before the wildcard character.
EXAMPLE Filtering or searching for A_C will not limit the results to those containing A_C as an actual underscore because, without the backslash, the underscore is treated as a wildcard character. Those results would also include ABC, for example, because the underscore serves as a wildcard for the middle character (in this case, B). Filtering or searching for A\_C will only populate results containing A_C as an actual underscore.
IMPORTANT The Legacy UI has been deprecated as of the 14.8.0 release. Refer to the Datto RMM 14.8.0 release notes.
A limited number of features from the legacy UI are not available in the New UI. For several of these deprecated features, we have introduced alternative solutions or new and improved functionality.
| Feature | Notes |
|---|---|
| Datto RMM standalone ticketing | We suggest using a PSA product for your ticketing needs. Autotask is deeply integrated with Datto RMM and provides ticketing, automation, and reporting to suit MSP needs and complexities. |
| Legacy Datto BCDR Integration | The Datto Continuity Integration has replaced the Datto BCDR Integration for a much richer and deeper integration experience. To configure the Datto Continuity Integration, navigate to Setup > Integrations > Datto Continuity. Enter your Datto Continuity credentials and set up monitors accordingly. Refer to Datto Continuity Integration. |
| Legacy Webroot Endpoint Security Integration | You can now deploy Webroot SecureAnywhere® Endpoint Protection automatically via a Software Management policy or by performing an ad-hoc installation via a job. Site-specific license keys and other installation parameters are configured via variables at either the global or site level. Webroot automatically identifies its status to Datto RMM and can be monitored for installation compliance using the Antivirus Status Monitor. To perform Webroot-specific monitoring, such as identifying infected devices, licensing issues, or feature status, you can use our dedicated Webroot SecureAnywhere Monitor components, available from the ComStore. Refer to Webroot SecureAnywhere Endpoint Protection for more information. |
| Job Alerts | Job Alerts function differently to normal alerts, and we are looking to bring job alerting in line with the rest of the product. NOTE This does not relate to emails you can configure with relation to jobs. Many use cases for Job Alerts are better fulfilled by component monitors, which can generate standard alerts and support tickets once a certain state is detected on devices. |
| Power Rating/Energy Usage | The power savings information was not commonly used and will be deprecated. |
| Power policies | To apply power settings to a device, we recommend you use the relevant ComStore component. The Power Settings component from the ComStore, available on Windows, offers expanded functionality to apply Power policies to devices. Refer to ComStore for details. |
| Site-level UDFs labels | Overriding UDF labels at the site level could lead to confusion when aggregating data globally. We recommend that UDFs be defined globally and used consistently for all devices. When UDFs are exposed in report or CSV downloads, the global (account-level) labels are always used. |
| On-connect jobs schedule option | The Initial Audit recurrence type, which allows jobs to run once a full audit has been completed by the device, will serve as a replacement to the on-connect option. Jobs of this type may be set against filters, a value beyond the scope of on-connect jobs. Refer to Scheduled jobs for information about scheduling jobs and the various recurrence options. |
| Favorite devices | The new web interface leverages quick access to recent devices and sites while also offering significant improvements to the way Device Groups work. |
| Favorite components | Favoriting components is no longer a requirement for use in quick jobs; users can quickly search for components when creating a job. |
| Suspended devices | Use the unscheduled maintenance mode or the Maintenance policy, as appropriate. Refer to Creating an unscheduled maintenance mode window and Maintenance policy. |
| Component Editor - Image Library | Users will need to upload a new image for components they create. |
| Component Editor - JavaScript, Ruby, Groovy, Python scripts support | Depending on the scripting language, Datto RMM can invoke various runtimes directly. For example, rather than attaching Python code directly to a component, attach the code as a PY file and invoke Python with the file as an argument on the local device. You may execute this process with your preferred runtime in place (for example, Node.js, and so forth). |
| Extensions/Integrations section in ComStore | Integrations have been moved to their own area under Setup. |
| MDM | The Mobile Device Management module was completely deprecated. |
| QR codes | QR codes are not available. |


