Column Chooser field definitions
The Column Chooser allows you to you select which columns are visible in the web interface. You may also drag and drop any of the columns to rearrange their order, sort on some of the columns as indicated by the Sortable? column, or export some columns to CSV format as indicated by the Exportable? column. Rearranging the order of columns, adding or removing columns, sorting, and filtering changes will persist across the Devices and Sites pages.
NOTE The Column Chooser will not be displayed for tables if there are no rows in the table.
In the Column Chooser, options that are gray and not selectable are columns shown in the web interface by default. Some columns may also allow you to filter on certain attributes. You may have to scroll down in the Column Chooser to see all available columns. Click Reset to restore the default view.
Time stamps reflect the user time zone and preferred date format configured on the Setup > My Settings page. Hovering over any time stamp will show its date in the alternative format. Refer to User Time Zone and Date Format.
Refer to Alerts.
| Field | Sortable? | Exportable? | Note |
|---|---|---|---|
| Category |

|
|
Displays the monitor category that this alert falls under. To narrow the list, click the filter icon  and select one or more categories. and select one or more categories.NOTE Filtering is not available for this column in the Recent Alerts widget. |
| Created |
|
|
Displays when the alert was created. Time stamps reflect the user time zone and preferred date format configured on the Setup > My Settings page. Hovering over any time stamp will show its date in the alternative format. Refer to User Time Zone and Date Format. Click the filter icon and select one of the following options: Last 24 Hours, Last 7 Days, Last 14 Days, Last 30 Days, Last 60 Days, Last 90 Days, Last 180 Days, or Custom where you can specify a custom start/end date and time by using the calendar.NOTE Filtering is not available for this column in the Recent Alerts widget. |
| Hostname |
|
|
Displays the hostname of the device that the alert was triggered from. Not available at the device level. Click the link to open the device summary page. Refer to Device summary. To narrow the list, click the filter icon , enter a term, and click Apply. To see the full list, click Reset.NOTE Filtering is not available for this column in the Recent Alerts widget. |
| Message |
|
Displays the alert message. Click the message to see the alert information. Refer to Single Alert View. | |
| Monitor Type |
|
|
Displays the monitor type. Click the link to see the monitor details. Refer to Viewing monitor details. To narrow the list, click the filter icon and select one or more monitor types. Refer to Monitor types.NOTE Filtering is not available for this column in the Recent Alerts widget. |
| Priority |
|
|
Displays the priority of the alert. The priority legend (from highest to lowest) is as follows:
Click the filter icon
NOTE Filtering is not available for this column in the Recent Alerts widget. |
| Resolved |
|
|
Displays when the alert was resolved. Click the filter icon and select one of the following options: Last 24 Hours, Last 7 Days, Last 14 Days, Last 30 Days, Last 60 Days, Last 90 Days, Last 180 Days, or Custom where you can specify a custom start/end date and time by using the calendar.NOTE Filtering is not available for this column in the Recent Alerts widget. |
| Resolved By |
|
|
Displays the username of the user who resolved the alert. If the alert was resolved by the system, Auto is displayed. To narrow the list, click the filter icon , enter a term, and click Apply. To see the full list, click Reset.NOTE Filtering is not available for this column in the Recent Alerts widget. |
| Site |
|
|
Displays the name of the site that the device belongs to. Not available at the site level and only available at the device level when opening the Alerts card on the device summary page in full-screen mode. Click the link to open the site summary page. Refer to Site summary. To narrow the list, click the filter icon , enter a term, and click Apply. To see the full list, click Reset.NOTE Filtering is not available for this column in the Recent Alerts widget. |
| Status |
|
|
Displays the status of the alert. Click the filter icon and click Resolved or Open to filter by the status of the alerts. To see the full list, click All.NOTE Filtering is not available for this column in the Recent Alerts widget. |
| Ticket |
|
|
Displays a ticket number if the monitor was configured to create a ticket when an alert is raised. Refer to Creating a monitor. If a PSA integration is enabled and you click the ticket number, the ticket will open in a new window in your PSA. If you are already logged in to your PSA or single sign-on is configured for you, you will be directed to the ticket. If you are not logged in to your PSA, you will be required to enter your login credentials first. To narrow the list, click the filter icon , enter a term, and click Apply. To see the full list, click Reset.NOTE Filtering is not available for this column in the Recent Alerts widget. |


Refer to Devices.
| Field | Sortable? | Exportable? | Note |
|---|---|---|---|
| .NET Version |
|
|
The .NET version of the device. |
| Additional IPs |
|
||
| Agent Version |

|
|
|
| Approved Pending Patches |
|
|
Displays the number of approved pending patches. |
| Assigned Network Node |
|
|
Refer to Networks. To narrow the list, click the filter icon , enter a term, and click Apply. To see the full list, click Reset. |
| AV Product |
|
|
Refer to Antivirus products. To narrow the list, click the filter icon , enter a term, and click Apply. To see the full list, click Reset. |
| AV Status |
|
|
Refer to Antivirus status. Click the filter icon and click Not Running, Not Detected, Running And Not Up To Date, or Running And Up To Date to filter by the status of the devices. |
| BIOS Name |
|
|
|
| BIOS Released |
|
|
|
| BIOS Version |
|
|
|
| Created |
|
|
Displays when the device was created. Time stamps reflect the user time zone and preferred date format configured on the Setup > My Settings page. Hovering over any time stamp will show its date in the alternative format. Refer to User Time Zone and Date Format. |
| Date Deleted |
|
|
Only displayed in the queue for deleted devices. Refer to Deleting a device. Displays when the device was marked for deletion. Time stamps reflect the user time zone and preferred date format configured on the Setup > My Settings page. Hovering over any time stamp will show its date in the alternative format. Refer to User Time Zone and Date Format. |
| Description |
|
|
Displays the description of the device. To narrow the list, click the filter icon , enter a term, and click Apply. To see the full list, click Reset. |
| Device CPU |
|
|
|
| Display Adapters |
|
|
|
| Display Version |
|
|
|
| Domain |
|
|
The domain the device belongs to. |
| EDR Install Date |
|
|
Only displayed if Datto Endpoint Security is enabled. Refer to Datto Endpoint Security in Endpoint Security policy. Displays the date when Datto Endpoint Security was enabled for the device. |
| EDR Status |
|
|
Only displayed if Datto Endpoint Security is enabled. Displays the device's Datto Endpoint Security status. Click the filter icon and click any of the options to filter the list.For status descriptions, refer to Datto EDR in Endpoint Security statuses. |
| External IP |
|
|
The external IP address of the device. To narrow the list, click the filter icon , enter a term, and click Apply. To see the full list, click Reset. |
| Groups |
|
Displays the Device Groups and Site Device Groups this device belongs to. Refer to Creating a Device Group or Site Device Group. The listed groups will also display the tag color associated with this group. Refer to Tag Color. To narrow the list, click the filter icon , enter a term, and click Apply. To see the full list, click Reset. |
|
| Hostname |
|
|
Displays the name of the device. Click the hyperlink to open the device summary page. Refer to Device summary. To narrow the list, click the filter icon , enter a term, and click Apply. To see the full list, click Reset. |
| Installed Patches |
|
|
Displays the number of installed patches. |
| Internal IP |
|
|
The internal IP address of the device. To narrow the list, click the filter icon , enter a term, and click Apply. To see the full list, click Reset. |
| Is Network Node |
|
|
Displays whether or not the device has been designated as a Network Node. Click the filter icon and click Yes or No to filter the list. To see the full list, click All. |
| Last Audit |
|
|
The last time an audit was run on this device. Time stamps reflect the user time zone and preferred date format configured on the Setup > My Settings page. Hovering over any time stamp will show its date in the alternative format. Refer to User Time Zone and Date Format. |
| Last Reboot |
|
|
The last time this device was rebooted. Time stamps reflect the user time zone and preferred date format configured on the Setup > My Settings page. Hovering over any time stamp will show its date in the alternative format. Refer to User Time Zone and Date Format. |
| Last Seen |
|
|
The last time this device was online. For devices that are currently online, this column will show Currently online. Time stamps reflect the user time zone and preferred date format configured on the Setup > My Settings page. Hovering over any time stamp will show its date in the alternative format. Refer to User Time Zone and Date Format. |
| Last User |
|
|
The user that last logged in to the device. To narrow the list, click the filter icon , enter a term, and click Apply. To see the full list, click Reset. |
| Last Successful Patch Audit Date |
|
|
The last time a device's patch data was successfully audited. Time stamps reflect the user time zone and preferred date format configured on the Setup > My Settings page. Hovering over any time stamp will show its date in the alternative format. Refer to User Time Zone and Date Format. |
| MAC Address(es) | |||
| Managed |
|
|
Click the filter icon and click Yes or No to filter the list. To see the full list, click All. |
| Managed Antivirus |
|
|
Only displayed if Managed Windows Defender Antivirus is enabled. Click the filter icon and click Enforced or Inactive to filter by the status of the devices.Refer to Managed Windows Defender Antivirus in Endpoint Security statuses. |
| Manufacturer |
|
|
The manufacturer of the device (for example, Dell Inc.). |
| Memory (Usable) |
|
|
The total physical installed memory minus "hardware reserved" memory. |
| Model |
|
|
|
| Motherboard |
|
|
|
| Name |
|
|
Refer to Hostname. |
| NIC Vendor |
|
|
To narrow the list, click the filter icon , enter a term, and click Apply. To see the full list, click Reset. |
| Not Approved Patches |
|
|
Displays the number of patches that are not approved. |
|
Object ID |
|
|
To narrow the list, click the filter icon , enter a term, and click Apply. To see the full list, click Reset. |
|
|
|
Only displayed in the queue for deleted devices. Refer to Deleting a device. Click the site name to open the Site summary page. This is the site the device belonged to before the device was marked for deletion and moved to the queue for deleted devices. |
|
| OS |
|
|
The operating system of the device. |
| Patch Status |
|
|
Click the filter icon and click No Policy, No Data, Reboot Required, Install Error, Approved Pending, or Fully Patched to filter by the status of the devices. |
| Physical CPU Cores |
|
|
|
| Platform |
|
|
To narrow the list, click the filter icon , enter a term, and click Apply. To see the full list, click Reset. |
| Privacy Mode |
|
|
Click the filter icon and click On or Off to filter by the status of the devices. If a device's status changes, the status icon is automatically refreshed 60 seconds after the change. To see the full list of devices, click All. |
| Reboot Required |
|
|
Click the filter icon and click Yes or No to filter the list. To see the full list, click All. |
| RocketCyber Status |
|
|
Click the filter icon and click one of the options to filter the list. For status descriptions, refer to RocketCyber in Endpoint Security statuses. |
| RWD Status |
|
|
Only displayed if standalone Datto RMM Ransomware Detection or Datto Endpoint Security is enabled. Click the filter icon and click one of the options to filter the list.For status descriptions, refer to Ransomware Detection in Endpoint Security statuses. |
| Serial Number |
|
|
The serial number of the device. To narrow the list, click the filter icon , enter a term, and click Apply. To see the full list, click Reset.NOTE For Datto Networking devices, the MAC address populates this field. |
| Site |
|
Click the site name to open Devices page for that site.page. If you are viewing a site's devices, this column is not displayed by default, but it can be selected using the Column Chooser. | |
| SNMP Description |
|
|
|
| SNMP Location |
|
|
|
| SNMP Name |
|
|
|
| Software Status |
|
|
Click the filter icon and click one of the following statuses to filter the list:
To learn how to control whether software approval and installation are manual, are automatic, or do not require management, refer to Software or Advanced Software in Software Management policy. The Software Management summary list provides data on Managed software compliance at the global and site levels. Refer to Software Management summary list and Column Chooser - Software Management. |
| Status |
|
|
The column header (Status) is not displayed. Visual indicators help you identify whether a device is online (green circle) or offline (transparent circle). If a device's status changes, the status icon is automatically refreshed 60 seconds after the change. Click the filter icon and click Online or Offline to filter by the status of the devices. To see the full list of devices, click All. |
| Type |
|
|
Click the filter icon and select the type of devices you wish to view in the list. Click All to see all devices or Network device (All) to see all networking devices only. |
| UID |
|
|
The unique identifier of the device, which is automatically created upon adding the device to your Datto RMM account. |
| Update Microsoft Products |
|
|
Click the filter icon and click Yes or No to filter the list. To see the full list, click All. NOTE Filtering is not available for this column when looking at a list of devices targeted by a device filter. |
| Warranty Expiration |
|
|
Displays the date the device's warranty expires or is blank if no date is set. If the warranty has expired (the date is in the past), the date is highlighted in red. Refer to the Warranty Expiration field in the Summary card. Time stamps reflect the user time zone and preferred date format configured on the Setup > My Settings page. Hovering over any time stamp will show its date in the alternative format. Refer to User Time Zone and Date Format. Click the filter icon and click Expired, in next 30 days, in next 60 days, or in next 90 days to filter by the warranty expiration of the devices. To see the full list of devices, click All. |
| Web Port |
|
|
This value is used to check the health of the Agent connection to the platform. In instances where the monitoring Agent (AEMAgent) is not able to connect to the platform, the Web Port field will be set to Not OK. Selecting the Web Port column from the Column Chooser will allow you to find devices that are able to connect to the platform but are unable to send monitor data. When the connection is restored, the Web Port status will be set to OK. Click the filter icon and click OK or Not OK to filter by the status of the devices. To see the full list of devices, click All. |
| Windows Display Version |

|
|
Displays the "friendly name" used to identify the current build of Windows 10 and Windows Server 2016+ devices (for example, 1909 or 20H2). If the Datto RMM Agent fails to retrieve the data or if the device is older than Windows 10 or Windows Server 2016, the field will remain blank. To narrow the list, click the filter icon , enter a term, and click Apply. To see the full list, click Reset.NOTE Filtering is not available for this column when looking at a list of devices targeted by a device filter. |
| Windows Installation Type |
|
|
Displays the type of Windows installation (Client, Server, Server Core, Embedded, or Workstation). To narrow the list, click the filter icon , enter a term, and click Apply. To see the full list, click Reset.NOTE Filtering is not available for this column when looking at a list of devices targeted by a device filter. |
| Windows Update Agent Version |
|
|
To narrow the list, click the filter icon , select a filter restriction from the drop-down menu, enter a value, and click Apply. To see the full list, click Reset. NOTE The does not contain filter restriction will also include devices with no value. For more information, refer to A note on the "does not contain" criterion. NOTE Filtering is not available for this column when looking at a list of devices targeted by a device filter. |
| Windows Update Disabled |
|
|
Click the filter icon and click Yes or No to filter the list. To see the full list, click All. NOTE Filtering is not available for this column when looking at a list of devices targeted by a device filter. |
| Windows Update Server |
|
|
To narrow the list, click the filter icon , enter a term, and click Apply. To see the full list, click Reset. NOTE Filtering is not available for this column when looking at a list of devices targeted by a device filter. |
| Windows Update Service Start Type |
|
|
To narrow the list, click the filter icon , enter a term, and click Apply. To see the full list, click Reset. NOTE Filtering is not available for this column when looking at a list of devices targeted by a device filter. |
| Windows Update Source |
|
|
Click the filter icon and click Microsoft or Wsus to filter by the Windows Update source of the devices. NOTE Filtering is not available for this column when looking at a list of devices targeted by a device filter. |
| Windows Update Status Server |
|
|
To narrow the list, click the filter icon , enter a term, and click Apply. To see the full list, click Reset. NOTE Filtering is not available for this column when looking at a list of devices targeted by a device filter. |
| Windows Version |
|
|
Displays the Windows version number per the Microsoft standard versioning format based on the available data. The Windows version number may consist of two to four segments: major, minor, build, and revision version (for example, 10.0.19042.1466). To narrow the list, click the filter icon NOTE Filtering is not available for this column when looking at a list of devices targeted by a device filter. |
| WinHTTP Bypass List |
|
|
To narrow the list, click the filter icon , enter a term, and click Apply. To see the full list, click Reset. NOTE Filtering is not available for this column when looking at a list of devices targeted by a device filter. |
| WinHTTP Proxy Server |
|
|
To narrow the list, click the filter icon , enter a term, and click Apply. To see the full list, click Reset. NOTE Filtering is not available for this column when looking at a list of devices targeted by a device filter. |
| User-Defined Field (1-300) |
|
|
Refer to User-defined fields. To narrow the list, click the filter icon , enter a term, and click Apply. To see the full list, click Reset. |
Refer to Patch Management.
| Field | Sortable? | Description |
|---|---|---|
| Title |
|
The title of the patch. To narrow the list, click the filter icon , enter a term, and click Apply. To see the full list, click Reset. |
| Release Date |
|
Displays when the patch was released. |
| Severity |
|
Displays the priority of the patch as specified in Microsoft Security Bulletins. Refer to About Microsoft Update classifications. Click the filter icon and click Critical, Important, Moderate, Low, or Unspecified to filter by the priority of the patch. |
| Max Size |
|
Displays the size of the patch. |
| Require Reboot |
|
Displays if a reboot is required after the patch installation. Click the filter icon and click Yes or No. To see the full list of patches, click All. |
| Require User Input |
|
Displays if user input is required during the patch installation. Click the filter icon and click Yes or No. To see the full list of patches, click All. |
|
Install Status |
|
Displays the installation status of the patch. Click the filter icon |
| KB Article |
|
Displays a Microsoft Knowledge Base article number that is associated with the patch. Click the number to open the associated article in a new tab. To narrow the list, click the filter icon , enter all or part of an article number, and click Apply. To see the full list, click Reset. |
| Total Devices |
|
Displays the number of devices on which the patch has been installed, is approved pending, or has not been approved, depending on the selected category. Click the number to open the Device Filter Results, which is a list of the devices. Refer to Devices. Select one or more devices and click the Row Actions icon to access a number of actions, including Patch Now. Refer to Patch Now. 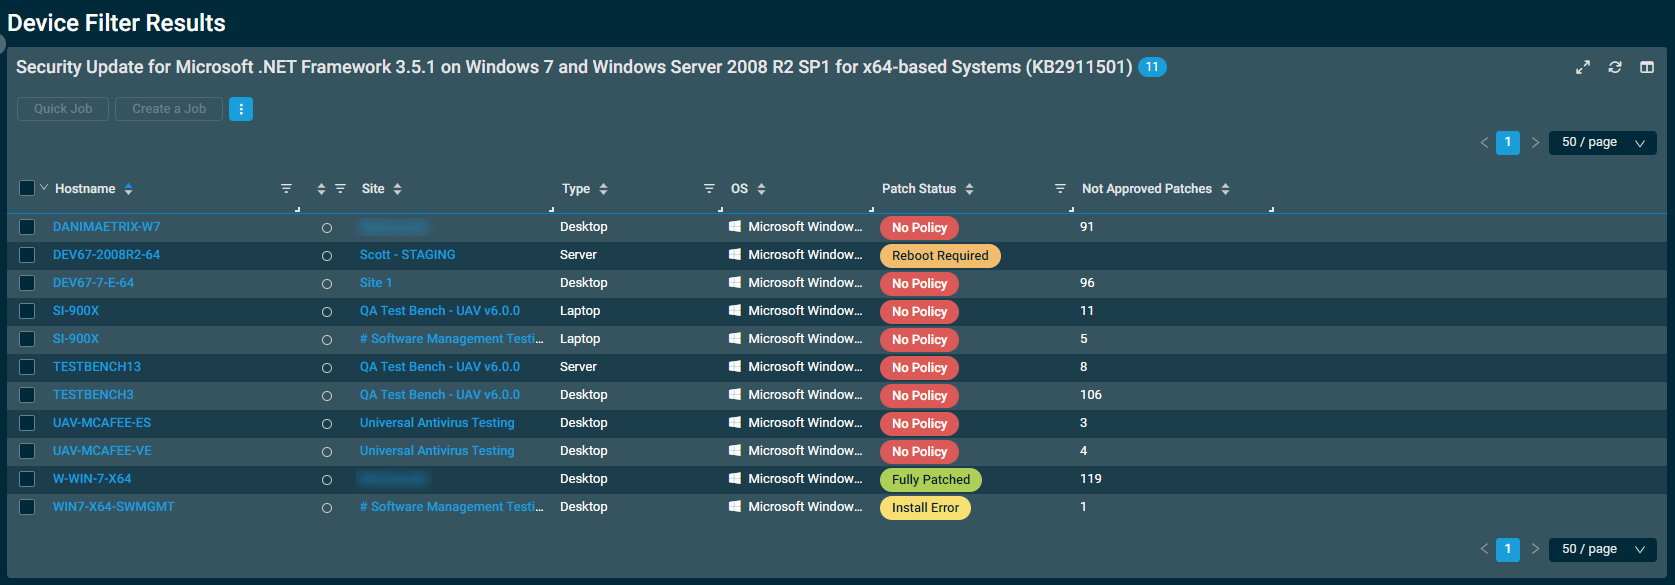 |
|
Description |
|
Displays the description of the patch. To narrow the list, click the filter icon |
|
Patch ID |
|
Displays the patch ID associated with the patch. To narrow the list, click the filter icon |
|
Type |
|
Displays the patch type assigned to the patch. Click the filter icon |
|
Category |
|
Displays the category of the patch. Click the filter icon |
Refer to Policies.
| Field | Sortable? | Exportable? | Description |
|---|---|---|---|
| Created |
|
|
Displays when the policy was created. Time stamps reflect the user time zone and preferred date format configured on the Setup > My Settings page. Hovering over any time stamp will show its date in the alternative format. Refer to User Time Zone and Date Format. |
| Created by |
|
|
Displays the username of the user who created the policy. |
| Enabled |
|
Displays whether the policy is currently enabled for the selected device, for the selected site, or globally. Click the filter icon and click Yes or No to filter by whether or not the policy is enabled. To see the full list, click All.
NOTE Filtering this column is not an option on a site-level list. To enable or disable the policy, turn the toggle within this column on or off, respectively. The change will be immediately saved and deployed. The Last deployed and Last edited values will change to the current date and time. The Last edited by value will change to the username of the user who turned the toggle on or off, if different from the user who most recently edited the policy. |
|
| Last deployed |
|
|
Displays when the policy last ran. Time stamps reflect the user time zone and preferred date format configured on the Setup > My Settings page. Hovering over any time stamp will show its date in the alternative format. Refer to User Time Zone and Date Format. |
| Last edited |
|
|
Displays when the policy was last edited. Time stamps reflect the user time zone and preferred date format configured on the Setup > My Settings page. Hovering over any time stamp will show its date in the alternative format. Refer to User Time Zone and Date Format. |
| Last edited by |
|
|
Displays the username of the user who last edited the policy. |
| Name |
|
|
The name of the policy. To narrow the list, click the filter icon , enter a term, and click Apply. To see the full list, click Reset. Click the policy name to edit the policy. Refer to Editing a policy. |
| Scope |
|
|
This field indicates whether the policy affects all sites or only one site in the Datto RMM account. Refer to Scope. Click the filter icon and click Global or Site to filter by the scope of the policy. To see the full list, click All. |
| Site |
|
|
If the policy is not global, this field displays the name of the site to which the policy applies. Click the site name to open the site's Devices page If viewing a site-level list of policies, this field includes only the selected site. |
| Targets |
|
|
A list of targets the policy will run against. Refer to Targets. |
| Type |
|
|
Displays the type of the policy. Refer to Type. To narrow the list, click the filter icon and select the policy types you want to see. |
Refer to Software.
| Field | Sortable? | Exportable? | Description |
|---|---|---|---|
| Software |
|
|
Displays the complete list of software applications at the global or site level. To narrow the list, click the filter icon , enter a term, and click Apply. To see the full list, click Reset. |
| Total Device(s) |
|
|
Displays the number of devices that have a particular software and version installed. Click the number to open the Device Filter Results, which is a list of the devices. Refer to Devices. |
| Version IMPORTANT The Version check box in the Column Chooser shows and hides both the Version column and the Uninstall column. |
|
|
Displays the version number of the software. IMPORTANT In this list, it may take up to 24 hours to show up-to-date versions of software installed via Software Management. NOTE Audit data that exceeds 1024 characters will be truncated and the truncated value will be saved. To narrow the list, click the filter icon |
| Uninstall IMPORTANT The Version check box in the Column Chooser shows and hides both the Version column and the Uninstall column. |
|
Only available for Windows software with an MSI uninstaller. This option is designed to be individually selected for each version of the software you wish to uninstall. Click the Uninstall button to schedule an immediate job that will mass-uninstall that version of the software on the Windows devices it is currently installed on. A confirmation dialog box will confirm the number of devices the software will be uninstalled on (Windows devices only). Click Confirm to execute the action or Cancel to close out of the dialog box. 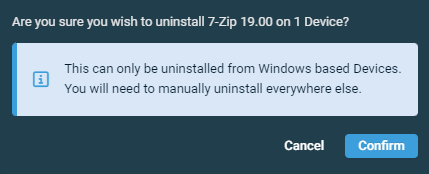 As the job is processing, the button will display Uninstalling. When the button changes to a link that displays Uninstall Running..., click the link to open the job results page. Refer to Job results. |
Refer to Software Management.
| Field | Sortable? | Exportable? | Description |
|---|---|---|---|
| Action |
|
N/A | Displays whether the software application has been set to install or uninstall. The Uninstall action is applicable only to advanced software. Refer to Advanced Software in Software Management policy. Click the filter icon and click Install or Uninstall. To see the full list, clear the filter.NOTE Software with both the Compliant status and Uninstall status will not appear in the list, as this combination indicates the software has been successfully uninstalled from all targeted devices. |
| Approval Required |
|
N/A | Displays whether or not manual approval is required for that type and version of the software to be approved for the device(s). Click the filter icon and click Yes or No to filter by whether or not manual approval is required. To see the full list, click All. |
| Software |
|
N/A | Displays the complete list of Managed software applications included in a Software Management policy at the global or site level. To narrow the list, click the filter icon , enter a term, and click Apply. To see the full list, click Reset. |
| Software Status |
|
N/A | Displays either of the following software compliance statuses:
Click the filter icon |
| Total Device(s) |
|
N/A | Displays the number of devices that meet the criteria shown in the row for that particular Managed software (that is, the devices are either compliant or non-compliant and do or do not require manual approval for a software update). Click the number to open the Device Filter Results, which is a list of the devices. Refer to Devices. From here, you can click the hostname of a device to navigate to the Software card on the device summary page and view additional details about software on the device. Refer to Software in Device summary. NOTE The Software Status column for a device may differ in the Software Management table and the Device Filter Results table. In the Software Management table, this column reflects the device's compliance status for a particular software application. In the Device Filter Results table, this column reflects the device's overall software compliance status. For example, the device may be compliant for the software listed in the Software Management table but non-compliant for other software. |
| Type (available from Type/Version option in Column Chooser) |
|
N/A | Displays the operating system version that supports the software application. Click the filter icon and click Windows 64-Bit, Windows 32-Bit, or macOS to filter by the operating system. |
| Latest Version (available from Type/Version option in Column Chooser) |
|
N/A | Displays the latest available version of that type of software application. NOTE The Latest Version field for Bitdefender, Microsoft Teams, and Webroot SecureAnywhere is static and does not change. Datto RMM Software Management is only concerned with deployment for these applications; once installed, the applications will update themselves without Software Management's involvement. To narrow the list, click the filter icon |
Refer to Users.
| Field | Sortable? | Exportable? | Note |
|---|---|---|---|
| Administrator |
|
Toggle the button on to add the Administrator security level to the list of the user's available security levels, or toggle it off to remove the Administrator security level from the list. The toggle is not displayed in the following scenarios:
|
|
| API Enabled |
|
Click the filter icon and click Yes or No to filter the list. To see the full list, click All. |
|
| API Key |
|
|
To narrow the list, click the filter icon , enter a term, and click Apply. To see the full list, click Reset. |
| API Key Created |
|
|
Displays the date and time when the API key was created. Time stamps reflect the user time zone and preferred date format configured on the Setup > My Settings page. Hovering over any time stamp will show its date in the alternative format. Refer to User Time Zone and Date Format. |
| API URL |
|
Displays the API URL. | |
| Component Level |
|
|
Displays the user's component level. Click the filter icon and click any of the following options to filter the list: Basic (1), Low (2), Medium (3), High (4), or Super (5). |
| Date Created |
|
|
Displays the date when the user was created. Time stamps reflect the user time zone and preferred date format configured on the Setup > My Settings page. Hovering over any time stamp will show its date in the alternative format. Refer to User Time Zone and Date Format. |
| Deactivation |
|
|
Displays if the user account is configured to expire. Click the filter icon and click Has expiration or No expiration to filter the list. To see the full list, click All. |
| Default Security Level |
|
Displays the user's default security level. | |
| Email Address |
|
|
Displays the user's email address. |
| First Name |
|
|
Displays the user's first name. |
| Last Logged In |
|
|
Displays when the user last logged in. Time stamps reflect the user time zone and preferred date format configured on the Setup > My Settings page. Hovering over any time stamp will show its date in the alternative format. Refer to User Time Zone and Date Format. |
| Last Name |
|
|
Displays the user's last name. |
| Last Password Change |
|
Displays when the user last changed their password. Time stamps reflect the user time zone and preferred date format configured on the Setup > My Settings page. Hovering over any time stamp will show its date in the alternative format. Refer to User Time Zone and Date Format. |
|
| Security Levels |
|
Displays a list of the user's available security levels. For longer lists, click the more link to expand the list. Click Show Less to collapse the list. |
|
| SSO Status |
|
Displays if the user account is linked to an Autotask user profile using single sign-on (SSO) via the Autotask Integration. Click the filter icon and click any of the following options to filter the list: Linked, Not linked, or Not set. Not set indicates that the integration or the SSO section within the integration has not been configured. |
|
| Support Access |
|
Displays if support access is enabled for the user account. When enabled, the expiration date and time are displayed. |
|
| User Status |
|
Click the filter icon and click Active or Inactive to filter the list. To see the full list, click All. |
|
| Username |
|
|
To narrow the list, click the filter icon , enter a term, and click Apply. To see the full list, click Reset. |


