Datto RMM 10.5.0 release notes
Schedule*
| Platform | Date | From (UTC) | To (UTC) | Duration |
|---|---|---|---|---|
| Syrah (APAC) | Monday, March 28, 2022 | 10:00 | 13:00 | 3 hrs |
| Zinfandel (US West) | Wednesday, March 30, 2022 | 08:00 | 11:00 | 3 hrs |
| Concord (US East) | Thursday, March 31, 2022 | 08:00 | 11:00 | 3 hrs |
| Merlot (EU2) | Thursday, March 31, 2022 | 17:00 | 20:00 | 3 hrs |
| Pinotage (EU1) | Monday, April 4, 2022 | 17:00 | 20:00 | 3 hrs |
NOTE *The schedule is subject to change. Please check the Status page for regular updates. When changes are made to the original schedule, those changes are denoted in red.
IMPORTANT This is a full platform and Agent release; therefore, partners should expect disconnection of the Agent during the update window.
About the release
The 10.5.0 release is the third of our twelve monthly releases planned for 2022. Please see below for the highlights, along with the full list of fixes and improvements.
Webhook notifications
We are excited to announce the release of webhook notifications. These will provide you with a powerful new capability for customizable alert content and actions to external systems; for example, configuring alert notifications in Microsoft Teams or providing JSON payloads to power workflow automation in products such as Microsoft Azure Functions, Power Automate, and Zapier. Refer to Webhooks.
Webhook notifications also provide the following benefits:
- Get notified about critical issues directly where you work. While many techs work from a ticketing system such as Autotask, collaboration apps like Microsoft Teams and Slack have become incredibly popular both for collaboration and notification of important events. With webhook notifications for Datto RMM, you can now get notified of new alerts and resolutions directly where you collaborate with your colleagues every day.
- Provide the right information and actions, to the right tech, at the right time. Webhook notifications contain powerful customization options, such as variables to provide the right information, empowering techs to take action directly. What does this mean? It means that you can configure exactly what information is in a notification (for example, recommended resolution steps, links to a KB article, or other useful locations such as device or alert pages).
The following is an example using Microsoft Teams. Using Cards in Microsoft Teams, the message passes along important alert information with actions and customized steps for a tech to take when working on an issue.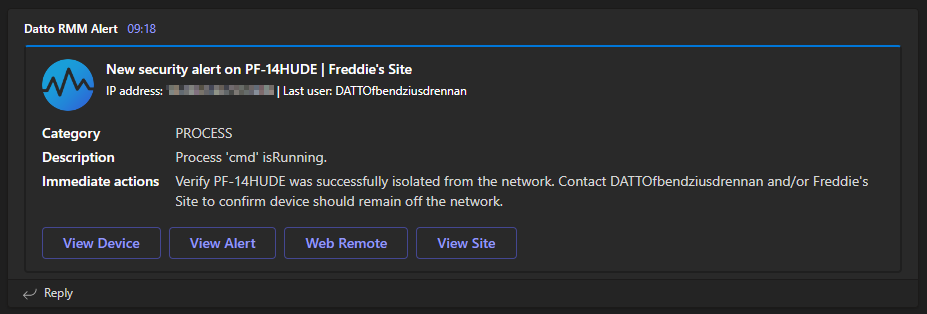
Configuration for webhook notifications takes place when creating or editing a monitor as an additional response option. Configuration includes building out payloads. The example below uses JSON for both the alert raised and the alert resolved events. This includes support for numerous variables and powerful customization options, such as constructing URLs to initiate actions like Web Remote right from Microsoft Teams.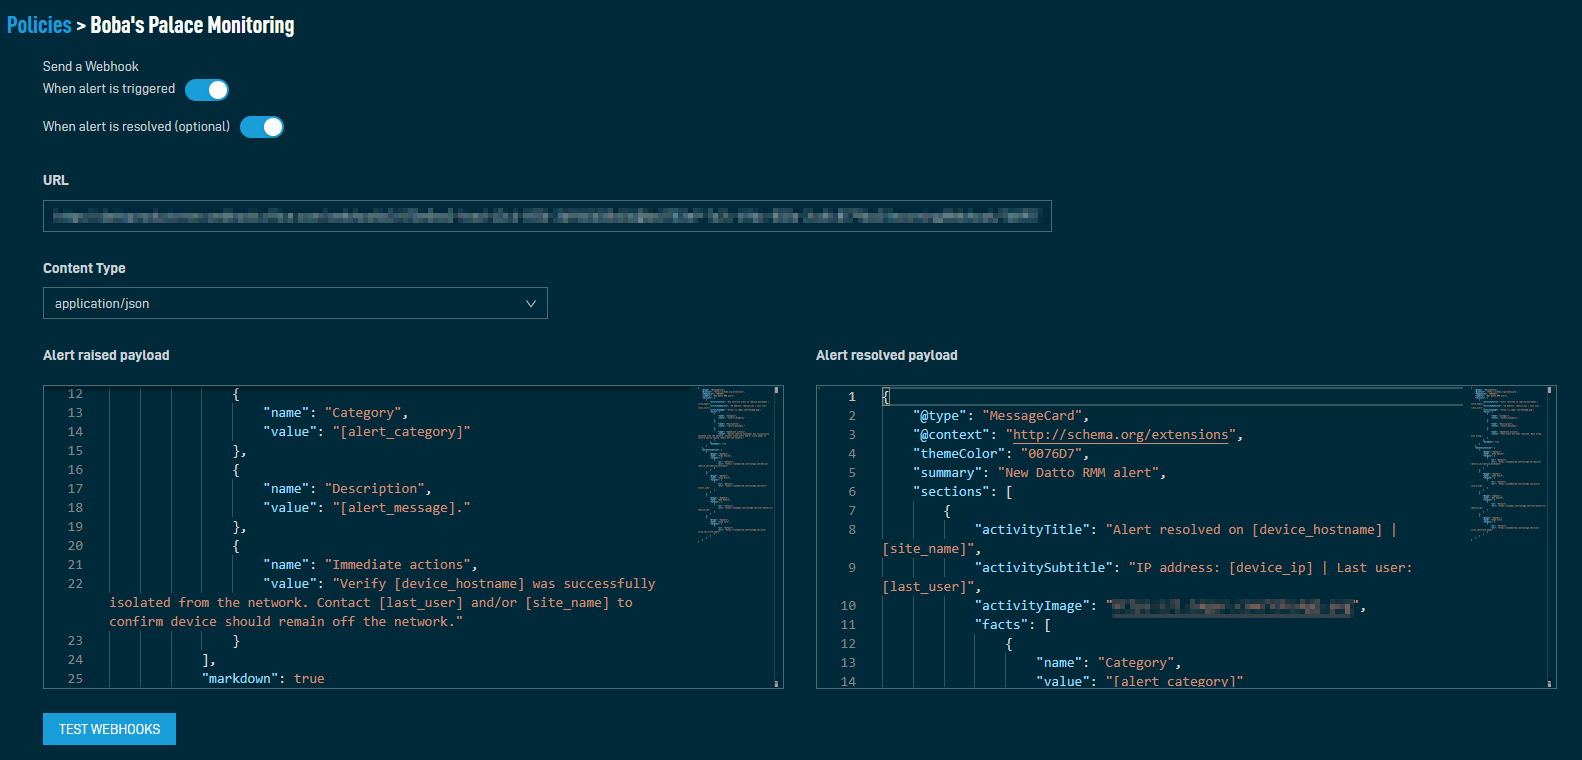
The flexibility of webhook notifications is that they function with a smorgasbord of options, providing almost limitless possibilities. We look forward to seeing how this feature is used!
For more information about using webhook notifications with Microsoft Teams, including access to pre-built templates, refer to Configuring webhook notifications for Microsoft Teams.
VIDEO Webhook Notifications Partner Interview
Join Senior Product Manager Frederick Bendžius-Drennan for an exclusive MSP interview to discuss webhooks in the New UI, including examples of webhook notifications for Microsoft Teams and Power Automate.
Device Summary Page updates
We made a number of updates to cards within the device summary page to help technicians access the information they need faster. This includes the addition of a new System card, which combines information from the previous Hardware and Software cards, along with new fields displaying the full Windows Version and Windows Display Version for Windows devices. Refer to System.
The Summary card has also been refreshed to complement the information present on the System card. Refer to Summary.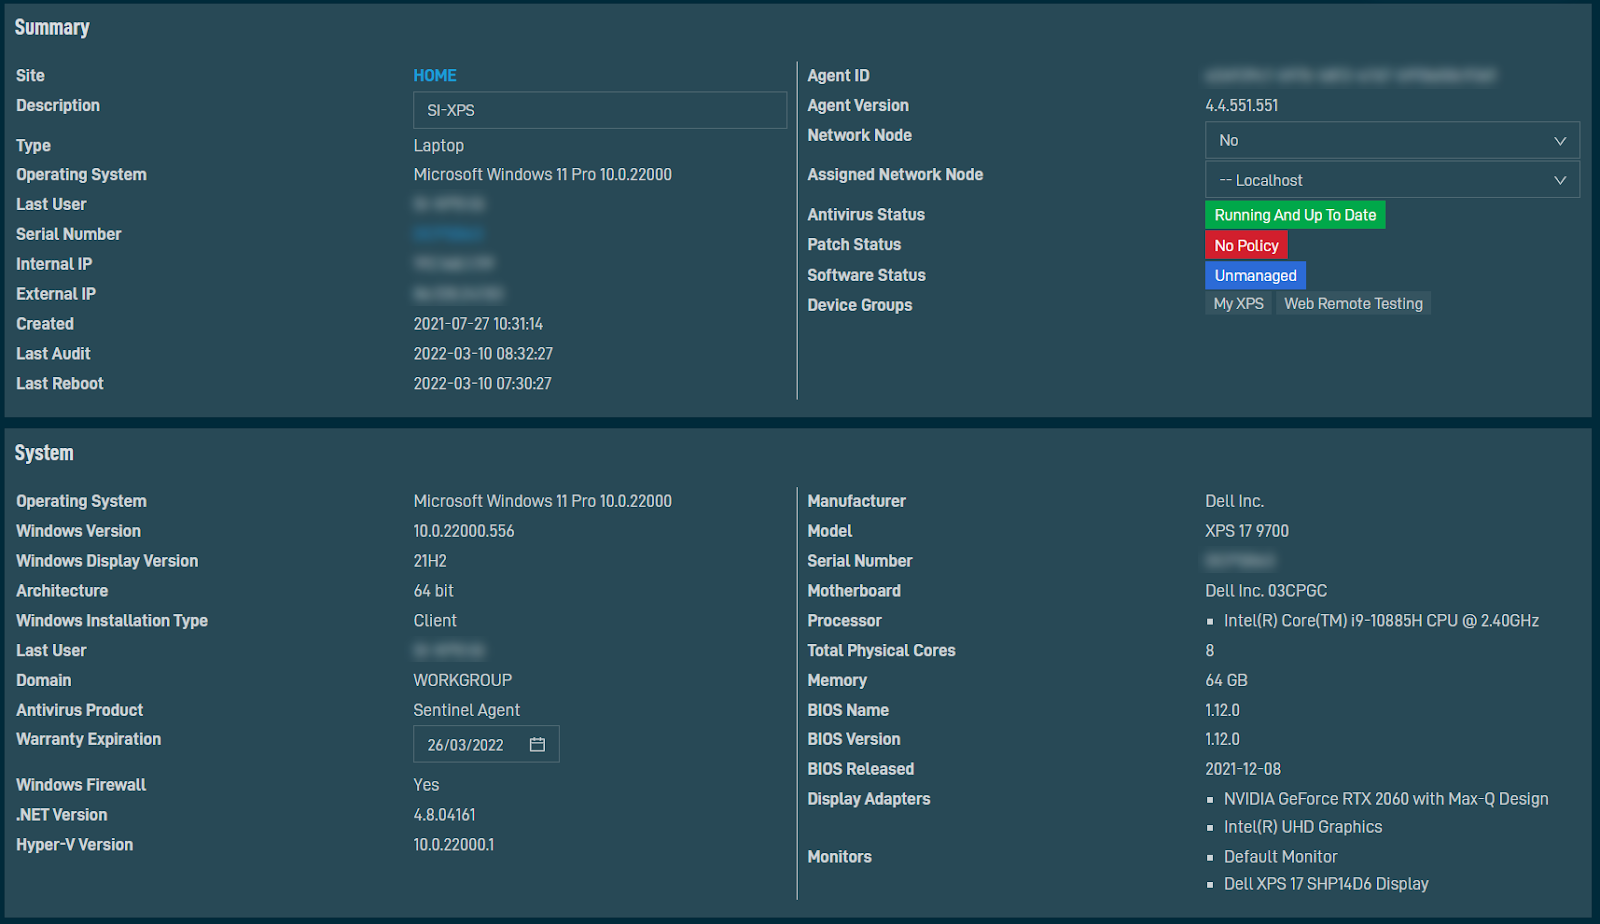
IMPORTANT The System card will be located at the bottom of the device summary page if the cards have previously been re-ordered.
Other updates
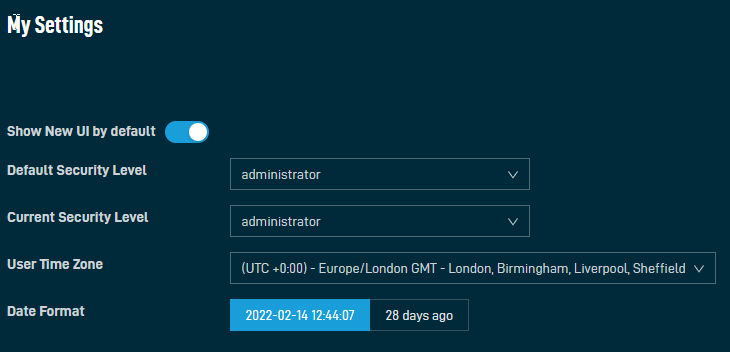
- Time stamp improvements. You can now change how time stamps are formatted in the New UI. We’ve defaulted all users to show time stamps in the ISO 8601 format. You can toggle this setting on the My Settings page in the New UI. Refer to Date Format.
- Windows Update device list columns. You can now select and filter new device list columns. Refer to Column Chooser - Devices.
- Windows Update Agent Version
- Windows Update Service Start Type
- Windows Update Source
- Windows Update Server
- Windows Update Status Server
- WinHTTP Proxy Server
- WinHTTP Bypass List
- Update Microsoft Products
- Windows Update Disabled
- Web Remote enhancements. We now better support devices with Hybrid Graphic Systems (refer to Cannot run Agent on guest GPU), improved our chances of initial connection success if a pre-existing Web Remote module is already available, and use the Windows Toast Notifier to display Privacy Mode notifications on Windows 10/Server 2016 and newer.
- Job enhancements. You can now access additional functionality when configuring jobs in the New UI, including email recipients and StdOut/StdErr settings. Refer to Notification.
- Report enhancements. You can now run a quick report from either device lists or the device summary page. Refer to Quick reports.
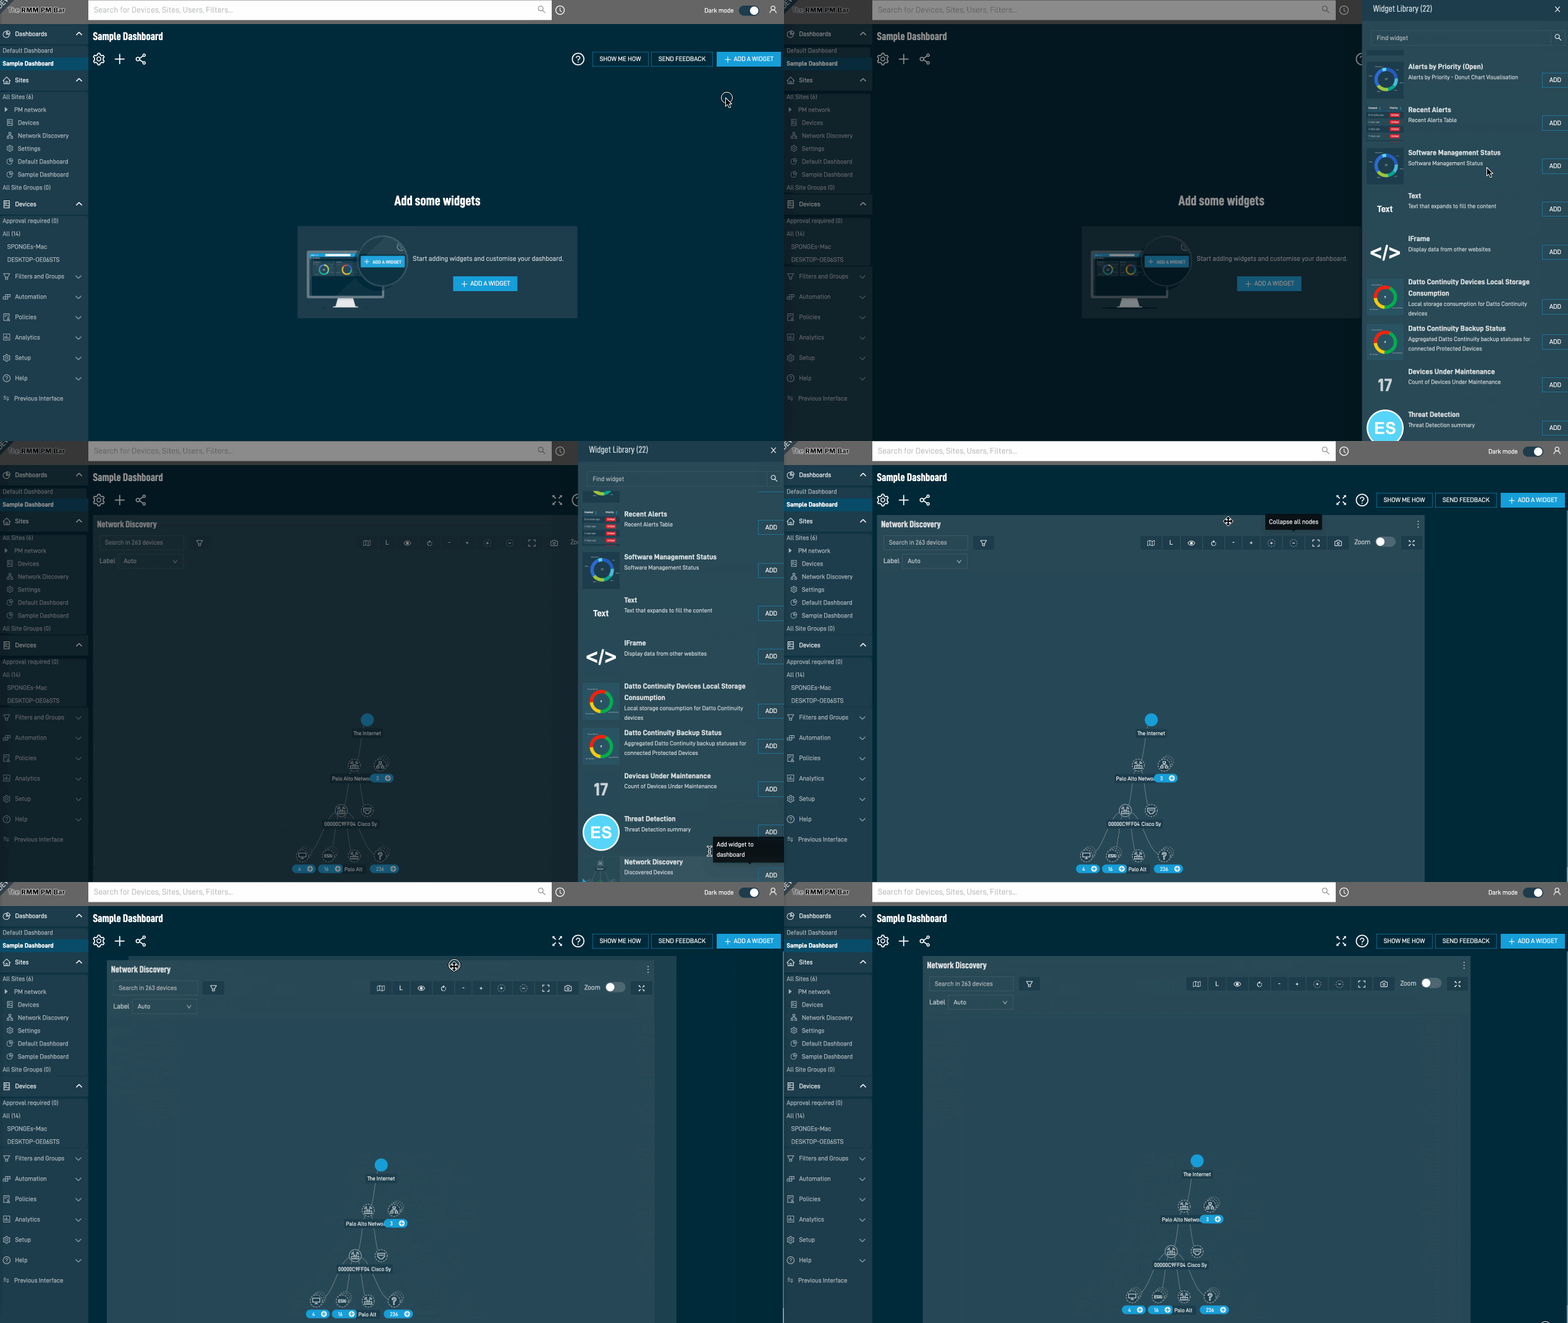
- Network Discovery widget. You can now add a network topology diagram for a site of interest on a dashboard. Refer to Network Discovery.
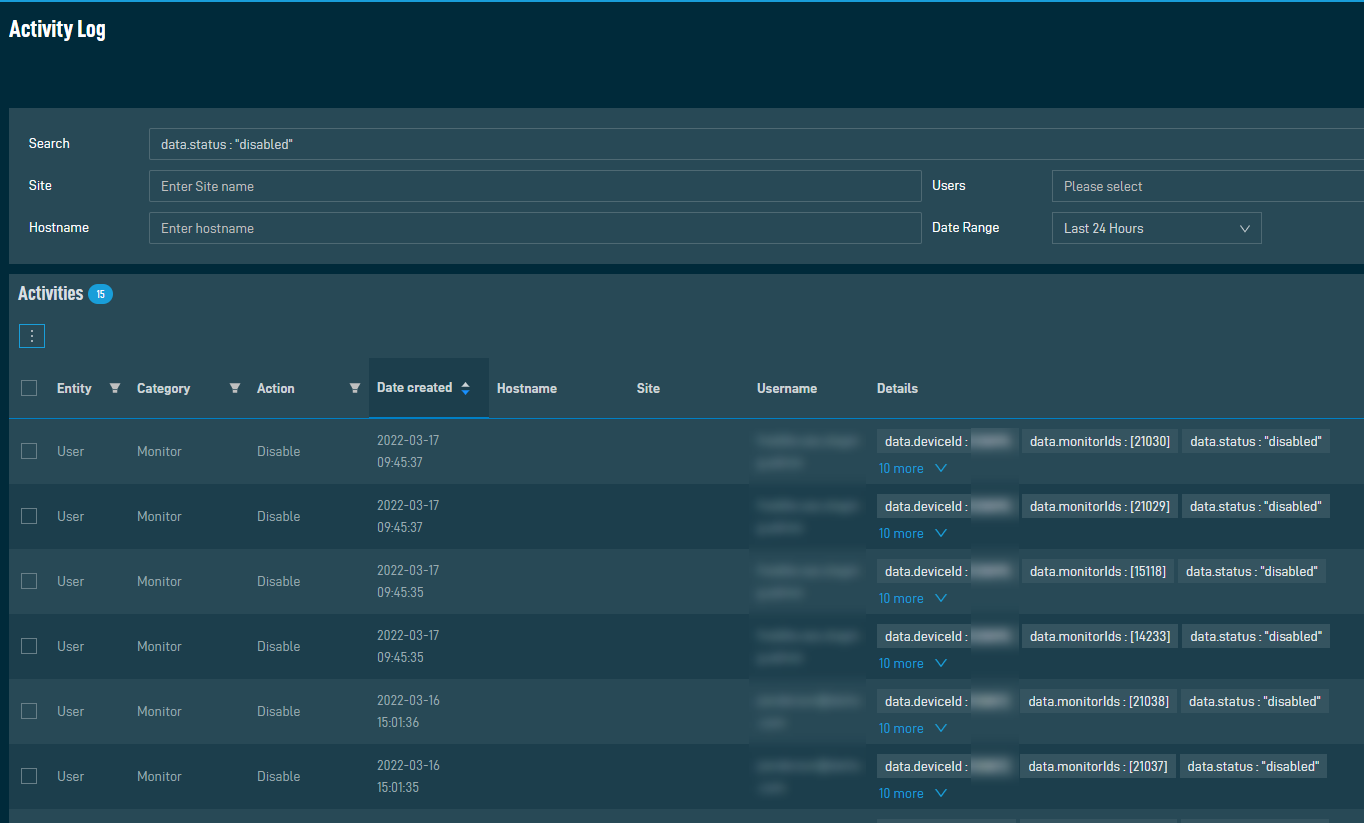
- Visibility of disabled monitors. We enhanced the Unified Activity Log to now provide visibility when a monitor has been disabled on a device either by a user or though alert rate limiting. Refer to Activity Log and Global monitor alert rate limit.
Additions to the ComStore
We release new ComStore components and update existing ones every month. Notable additions this month include the following components:
- ESXi VM Snapshot Monitor [WIN]: Use this to alert when any VM on an ESXi device has more snapshots than a predefined threshold. This component does not use ESXi credentials in the platform; a simple read-only user account will suffice.
- SIP Monitor [MAC]: Alert on the enablement of System Integrity Protection for your macOS devices.
- FileVault 2 [MAC]: Use to enable FileVault 2 on supported Macs and systems where the component has already been run once. Document the recovery key in a UDF.
NOTE To access a full list of ComStore components, refer to List of ComStore components.
Investments in platform and Agent performance
Beginning this release, we are introducing the Performance release note type alongside Feature and Fix to help partners understand the progression of our efforts to provide better overall quality of service. This information was previously only available internally, but feedback has shown an external interest in our activities in this area as well.
This release's performance highlight is that all endpoint logs will now be written in both human and machine-readable formats, with all Agents automatically uploading to the platform for further analysis.
We will have complete oversight of all Agent-level errors and warnings (including the Web Remote module), which were previously only available on a case-by-case basis from partners who manually submitted log files via Datto RMM Support.
Aggregating at the platform level will allow processing in a comparable way to other globally available log sources to identify trends and common problems in the field. This helps us work toward our goal of delivering improvements in the Agent and Web Remote experience comparable to the performance work we have achieved so far in the platform, as well as in the work we have planned for the future.
Video
VIDEO Datto RMM 10.5.0 Release Overview
Join Community Program Manager Melissa Hockenberry and Senior Product Manager Frederick Bendžius-Drennan as they provide a quick overview of the Datto RMM 10.5.0 release featuring webhook notifications, updates on the Device Summary page, new device list columns, and additions to the ComStore including new monitoring capabilities for macOS devices.
List of improvements and fixes
New UI
| Type | Summary |
|---|---|
| Feature | We added platform version information to the new Support page. Refer to Support. |
| Feature | We made various improvements to the dashboard layout, including improving screen resolution options, reintroducing the outlines that serve as visual guides for fixed resolutions, and making the option to hide the left navigation menu more discoverable. Refer to Setting screen resolution in Dashboards settings and Using the left and top navigation menus. |
| Feature | We added a user setting to view human-readable or time stamp formats for all dates and times. Refer to Date Format. |
| Feature | We added a user setting to select the Default Security Level from those assigned to the user. Refer to Default Security Level. |
| Feature | You can now configure StdOut/StdErr options for email notifications on the Create a Job and Edit a Job pages. Refer to Automatically Email StdOut/StdErr Options. |
| Feature | We added various Windows Update related columns to the column chooser on device list pages: Windows Update Agent Version, Windows Update Service Start Type, Windows Update Source, Windows Update Server, Windows Update Status Server, WinHTTP Proxy Server, WinHTTP Bypass List, Update Microsoft Products, and Windows Update Disabled. Refer to Column Chooser - Devices. |
| Feature | You can now configure email notifications on the Create a Job and Edit a Job pages. Refer to Notify Me If This Job. |
| Feature | You can now configure email recipients on the Create a Job and Edit a Job pages. Refer to Email Recipients. |
| Feature | We updated the confirmation message when the Patch Now action is used to more accurately reflect that the action has been scheduled immediately, rather than already completed. Refer to Patch Now. |
| Feature | We added the ability to run a quick report from device lists or the device summary page. Refer to Quick reports. |
| Feature | We updated the Summary card on the device summary page to improve visibility of key information. Refer to Summary. |
| Feature | We added the System card to the Device Summary page to consolidate related information and to remove the need for separate Hardware and Software cards. Refer to System. |
| Feature | You can now add a network topology diagram for a site of interest on a dashboard. Refer to Network Discovery. |
| Fix | We updated the PowerShell installation command on the Add Device page by specifying the download location. Refer to Adding a device. |
| Fix | We fixed an issue where only 250 sites were available to display on dashboards by increasing the limit to 25,000. Refer to Site filtering. |
Web Remote
| Type | Summary |
|---|---|
| Fix | We fixed a Web Remote issue where the "shift hold" state would be canceled after a shifted (uppercase) letter was sent to the remote device, even if the shift key was still depressed. |
| Performance | We now use the Windows Toast Notifier to display Privacy Mode notifications on Windows 10/Server 2016 and above. |
| Performance | We now better support devices with Hybrid Graphic Systems when connecting to them using Web Remote. Refer to Cannot run Agent on guest GPU. |
| Performance | We introduced structured logging for Web Remote to be both human and machine-readable for platform level aggregation and analysis. |
| Performance | We now send all Web Remote errors to the platform for aggregation and analysis. |
| Performance | We improved chances of a Web Remote initial connection success by using a pre-existing version during Agent startup, even if a newer version is available for download. |
Autotask Integration
| Type | Summary |
|---|---|
| Fix | We fixed an issue with the Autotask Integration so that users with View access to Configuration Items in Autotask can now successfully view these from within Datto RMM. Refer to Open in PSA and View in Autotask. |
| Fix | We fixed an issue with the Autotask Integration causing Datto RMM links to open in the legacy UI, regardless of the logged-in user's default UI setting in Datto RMM. |
ConnectWise PSA Integration
| Type | Summary |
|---|---|
| Fix | We fixed an issue with the ConnectWise PSA Integration where a mapped configuration would remain active despite the device being deleted from Datto RMM. |
| Fix | We fixed an issue preventing ConnectWise PSA agreements from mapping if a product ID has special characters in the name. |
| Fix | We fixed an issue causing ConnectWise PSA device mapping to default to Create New when a pre-existing device should be offered first. |
Agent
| Type | Summary |
|---|---|
| Feature | We no longer save credentials for the Agent Browser SNMP Test Tool to improve security. Refer to Connecting to a network device and testing an SNMP monitor. |
| Performance | We changed the encoding of Agent Process log files from UTF-16 to UTF-8 for a smaller file size and wider text editor support. Refer to Agent log files. |
| Performance | We introduced structured logging for the Agent Service and Agent Process to be both human and machine-readable for platform level aggregation and analysis. |
Agent communication
| Type | Summary |
|---|---|
| Fix | We fixed an issue where the alert status may not be correctly updated when an alert is resolved on the platform. |
| Performance | We removed the sending of legacy UI performance data from the Agent as it has been replaced by the more efficient Long-Term Metrics in the New UI. |
Components
| Type | Summary |
|---|---|
| Fix | We fixed an issue where input values for Selection variables would be lost when a component is copied in the New UI. |
| Fix | We fixed an issue where changing a component site selection from all sites to individual sites could not be saved if the action was performed in the legacy UI. |
| Fix | We fixed an issue where component output variables defined in the legacy UI were merged with input variables when edited and saved in the New UI, which was breaking intended functionality. Refer to Output Data and Variables. |
Device activity
| Type | Summary |
|---|---|
| Feature | We added RDS Session awareness of Web Remote connections to the device Activity Log. Refer to Activity Log. |
Jobs
| Type | Summary |
|---|---|
| Fix | We fixed an issue that could cause the job scheduler in the New UI to show the wrong scheduled weekday if a user's browser is in a different timezone than the platform. |
Linux
| Type | Summary |
|---|---|
| Fix | We fixed an issue making it possible for the Agent Process to run multiple times on Linux devices. |
macOS
| Type | Summary |
|---|---|
| Fix | We fixed an issue causing the Agent to stop functioning on macOS M1 devices that go into sleep mode. |
Monitoring
| Type | Summary |
|---|---|
| Feature | You can now configure webhook notifications to trigger when an alert is created or resolved. Refer to Webhooks. |
| Feature | You can now test webhook notifications from the monitor configuration page. Refer to Test a webhook. |
| Fix | We fixed an issue where monitor response components would not use site credentials. |
| Fix | We fixed an issue where the Disk Usage monitor would fail continuously after a critical error. |
| Fix | We fixed an issue preventing Component monitors from running on devices that depend on PowerShell version 2.0. |
Network management
| Type | Summary |
|---|---|
| Fix | We fixed an issue that could prevent SNMP devices using v3 credentials from returning audit information. |
Platform back end
| Type | Summary |
|---|---|
| Performance | We now ignore any legacy UI performance data sent from the Agent as it has been replaced by the more efficient Long-Term Metrics in the New UI. |
| Performance | We added a database flag for monitors to allow efficient future querying of active/disabled status and if disabled by a user or rate limiter. Refer to Activity Log and Global monitor alert rate limit. |
| Performance | We now ignore alerts raised more than six hours in the future or seven days in the past to allow us to optimize the alerts database index by partitioning based on created dates. |
| Performance | We improved the asynchronous task controlling the Agent status to avoid scenarios where it is marked as offline when connected to the platform. |
| Performance | We fixed an issue where some monitor polls could not be parsed and would log a platform exception. |
| Performance | We improved logging for the User Activity Logging service to be able to better troubleshoot failures. |
| Performance | We updated the Autotask ticket creation service to use the Long-Term Metrics source instead of the legacy UI performance data. |
| Performance | We prevented over-fetching on the jobs endpoint when requesting a page count in GraphQL queries. |
Reports
| Type | Summary |
|---|---|
| Feature | We updated the Monitoring Performance report to use data from the New UI Long-Term Metrics data source. |
Unified Activity Log
| Type | Summary |
|---|---|
| Feature | We added entries for monitors disabled by alert rate limiting or users to the Unified Activity Log. Refer to Activity Log and Global monitor alert rate limit. |
Web Portal
| Type | Summary |
|---|---|
| Feature | We removed the Performance graphs from device summary page in the legacy UI as they have been replaced by the Long-Term Metrics in the New UI. Refer to Device summary - Legacy UI. |
| Fix | We fixed an issue in the legacy UI where the Support tab would not load tickets for partners that do not use an external PSA integration. |
ComStore updates
IMPORTANT This table does not list updates for components that are installed via Software Management.
NOTE To access a full list of ComStore components, refer to List of ComStore components.
| Component Name | Platform | New/Changed/Removed | Description |
|---|---|---|---|
| CPU Temperature Monitor v3 | Windows | New | Replaces all previous CPU Temperature Monitor Components. Uses LibreHardwareMonitor to gauge CPU temperature. |
| CPU Temperature Monitor v2 | Windows | Removed | Replaced by above. |
| Cynet Monitor [LIN] | macOS/Linux | New | Vendor submission. |
| ESXi VM Snapshot Monitor | Windows | New | Uses a Windows-based device to alert if any VMs on an ESXi device have more than X snapshots. ESXi account credentials must be supplied via variables (read-only is sufficient). |
| FileVault 2 | macOS | New | Enables FileVault 2 on the first run and once enabled by the user, gathers the recovery key on the subsequent run. Can write data to UDF. |
| List Software Installations | Windows | New | Lists all software installation records from the Event Log. Can be used in conjunction with the Software Installation best-practice policy. |
| Deploy Windows Defender for Endpoint | Windows | New | Used to deploy Microsoft Defender-for-Endpoint, also known as Sense, Defender ATP, and Defender for Business. |
| SIP Monitor | macOS | New | Monitors System Integrity Protection enablement on a macOS device. |
| Acronis Cyber Protect - Deployment/Monitoring/Management | All | Changed | Vendor update. |
| Agent Health Direct-Check | Windows | Changed | Added checks for Unicode in system registry, improved FIPS checks, and bug fixes. |
| Datto Cloud Continuity Agent | Windows | Changed | Vendor update to version 1.2.6. |
| Datto File Protection & Server Monitor | Windows | Changed | Updated to improve handling of Service mode on Windows Servers. |
| Diagnose & Fix Windows Update Issues | Windows | Changed | Previously known as Windows Update Diagnostic Tool. Adds support for clearing WSUS settings. |
| Download and apply Windows Update File | Windows | Changed | Adds support for Windows 11 and Server 2022. |
| Emsisoft Anti-Malware | Windows | Changed | Vendor update. |
| Emsisoft Anti-Malware Monitor | Windows | Changed | Vendor update. |
| ESET Direct Endpoint Management - Deployment/Monitor/Tasks | Linux | Changed | Vendor update. |
| ESET Direct Endpoint Management - Monitor | Windows | Changed | Vendor update. |
| Liongard Agent | Windows | Changed | Vendor update. |
| Log4Shell Enumeration, Mitigation and Attack Detection Tool | Windows | Changed | Improved support for 32-bit devices. |
| Revert Device Isolation | Windows | Changed | Updated to cooperate with updates to device isolation (ransomware) subroutine. |
| Splashtop Streamer Pre-Installer | Windows | Changed | New digital signature for Splashtop installer added. |
| Webroot SecureAnywhere | Windows | Changed | Improved proxy server support. |
| Webroot SecureAnywhere Monitor | Windows | Changed | Removed two monitors which would alert endlessly and cause noise. |
| Windows 10: Upgrade or update to latest Feature Release | Windows | Changed | Improved resilience for method-two (Enterprise) installations. |
| Windows 11: Upgrade via ISO | Windows | Changed | Made TPM misidentification overridable in cases where the script was misreading TPM installation state. |
| Monitor Battery Cell Health | Windows | New | Refer to the CyberDrain Components tab of the spreadsheet in the following topic: List of ComStore components. |
| Deploy BlueScreenView | Windows | Changed | |
| Enable Bitlocker and Document to UDF | Windows | Changed | |
| Enable NuGet PowerShell Provider | Windows | Changed | |
| Monitor IIS SSL Certificates | Windows | Changed | |
| Monitor Interactive System Execution | Windows | Changed | |
| Monitor UniFi Device Health | Windows | Changed | |
| Unblock upgrade to Windows 11 | Windows | Changed |


